

Some of the most frequently asked questions we get in the Precision Amplifiers forum here in the E2E Community™ have to do with an IC’s long-term stability of various parameters. Nothing in nature is static, and the datasheet parameters are no exception.
Over time, semiconductor material doping levels, as well as physical stress exerted by the package on the die inside, undergo changes that lead to shifts in product parametric values. These shifts are quantified during new product qualification by measuring their parametric shift in the course of the life test – an accelerated aging process performed in high temperature ovens.
The duration of the typical life test (1000hrs @ 125C or 300hrs @ 150C) assures a minimum 10-year product life at room temperature, exclusive of quiescent condition self-heating, and its time is governed by the Arrhenius Equation – a simple but remarkably accurate formula that describes the temperature dependence of the reaction rate constant for a given process:
Process Rate (PR) = Ae-(Ea/kT) Arrhenius Equation
This leads to the concept of Acceleration Factor (AF), the ratio of process rates at two distinct temperatures, used to establish the duration of the required life test:
AF (T1 to T2) = PR(T1)/PR(T2) = e(Ea/k)(1/T1 - 1/T2)
where:
A - Process constant
Ea - Thermal activation energy in electron-volts [eV]
k - Boltzman’s constant, 8.62 x 10⁻⁵ [eV/K]
T - Absolute temperature in degrees Kelvin (deg C + 273.15)
Based on the actual product life test results, we are able to identify two types of datasheet parameters and quantify their respective life-time shift:
- Specifications centered around zero or a mean value (like Vos, Vos Drift, Vref, AOL, CMRR, PSRR, etc.) may shift over 10-year life up to:
+/-100% of the max (min) PDS specified value
- Specifications defined as an absolute value (like IQ, slew rate, Isc, etc.) may shift over 10-year life up to:
+/-10% of the max (min) PDS specified value
Most datasheet parameters follow a Normal (Gaussian) Distribution, shown if Figure 1, with about 68% of values within one standard deviation (+/-1-sigma) away from the mean, µ. Similarly, about 95% of the values lie within +/-2-sigma, and about 99.7% lie within +/-3-sigma, etc. The maximum and minimum PDS limits are set based on at least 3-sigma distributions and similarly life-time shifts are based on the same type of statistical analysis.
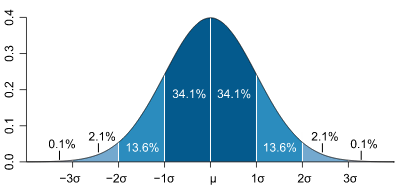
Figure 1* – Normal Gaussian Distribution
Figure 2 shows the long-term shift for the parameters centered around zero, or another mean value. The initial distribution curve in blue has a sigma of 0.5 while the end-of-life distribution curve in green has a sigma of 1.0.

Figure 2* – Pre- and post-life test distributions
Hence the final distribution spread is double the initial spread. That means the initial values may shift by +/-100% from the initial max/min datasheet specified value over 10 years.
To illustrate the life-time shift for an actual IC, let’s consider the long-term stability of the low-noise, low-drift REF5025 precision voltage reference and its output initial accuracy specification.
Figure 3 shows the initial accuracy of REF5025 output voltage of +/-0.05% and the long-term stability for 0 to 1000 hours specified at 50ppm. As explained above, the long-term shift of the REF5025 must not exceed the life-test shift of +/-100% of the max/min initial accuracy; therefore, the maximum output voltage shift after 10 years (87,600 hours), under constant operation at room temperature, must be less than +/-0.05%, or an equivalent of +/-500ppm.

Figure 3 - Excerpts from REF5025 datasheet
Since the long-term shift clearly cannot be a linear function of time and simultaneously satisfy both conditions, the shift rate must initially be higher (having a steeper slope) and then gradually slow down (becoming more linear) over time. Therefore, it may be estimated by the square-root function normalized to 1000th of hours and shown below in Figure 4.
Output Voltage Shift = 50ppm*√[time(hours)/1000hrs]

Figure 4 – REF5025 long-term stability
For example, after 25,000 hours of nonstop operation in the field, the typical output voltage shift in the REF5025 can be calculated using above equation, 50ppm*√25=250ppm, while after 10 years (87,600 hours) the shift would be 50ppm*√87.6=468pp. Therefore, at the end-of-life the REF5025 output voltage shift as expected is within the 500ppm allowable shift which equals to 0.05% of the datasheet maximum initial accuracy spec.
* Source: Wikipedia
