This thread has been locked.

If you have a related question, please click the "Ask a related question" button in the top right corner. The newly created question will be automatically linked to this question.

INA223: Need INA223's IB vs Differential Voltage's Chart - 01/18/2018

Part Number: INA223

Hello Patrick,

Addition to the thread at INA223: Need INA223's IB vs Differential Voltage's Chart

With the concept on the left, can I say that the IB+ ramps from 0uV to 25uA as differential input voltage increasing, and the IB- keeps at 1uA all the way?
I am writing a spreadsheet to calculate the IB impact per customer's request, thus we need official data to make it properly.


Thanks a lot

Wayne Chen
01/18/2018

  • Hello Wayne,

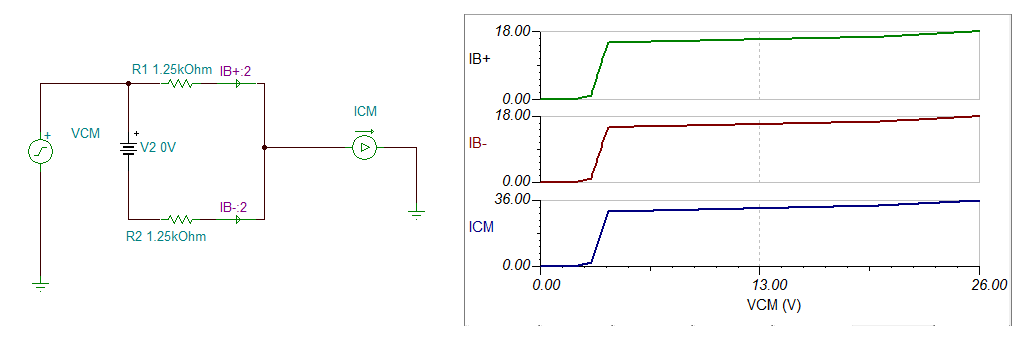
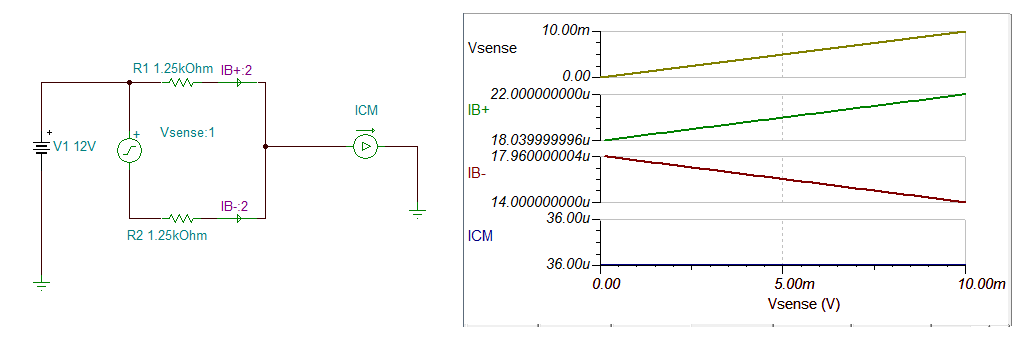
    In the previous thread I may have led you a bit astray.  The input bias currents sum into the common  mode input current.  The specification you see in the table you have above is what the input bias current would be at either Vin+ or Vin- at 12V common mode where Vsense is 0V.  As Vsense increases the IB+ will increase will IB- will decrease, however the sum of those currents will remain the same for a given common mode voltage.  Below in figure 1 I show what currents you should see at pins Vin+ and Vin- when Vsense=0V, but the Common mode voltage varies.  The values I use are an approximation from the typical values in the table and graphs supplied in the datasheet.  So it is possible that some devices may perform better or worse than this.   In figure 2, I show the behavior you would expect to see when the common mode is 12V and Vsense is varied.

    Figure 1

    Figure 2