This thread has been locked.

If you have a related question, please click the "Ask a related question" button in the top right corner. The newly created question will be automatically linked to this question.

TINA/Spice/LMP2021: stability Analysis - 1.TINA's input model v.s. real circuit input 2. Zout v.s. frequency figure

Part Number: LMP2021
Other Parts Discussed in Thread: TINA-TI,

Tool/software: TINA-TI or Spice Models

Hi team,


I'm doing stability measurement and using TINA simulation to check with the result and I found some questions,

1. When I do the stability measurement , add Capacitance=30pF at LMP2021's input and see overshoot% is around 38%(figure 3.),
 check with figure 4. and it shows that phase margin is near 30° , but when I do the simulation on TINA, I have to add another Cin=47pF(figure 5.)
 to meet same phase margin, so my question is what the difference between real circuit input and TINA simulation's input model ?  


figure 1. LMP2021Test Board 

figure 2. measurement configuration 

figure 3. overshoot % measurement(Add Cin= 30pF)


figure 4. Overshoot v.s. Phase Margin

figure 5. LMP2021 TINA stability simulation  

2. Do LMP2021 provide Zout v.s. frequency figure? 


Thanks you very much!


  • Andy,

    The stability of your circuit is determined by the location of the zero in the 1/beta curve caused by addition of capacitance on the inverting input terminal.  Some of the worst things one may do from the circuit stability point of view is to use the large values resistors or add capacitance to the inverting input (RC time delay).

    Please watch TI Precision Labs video explaining the issue: 

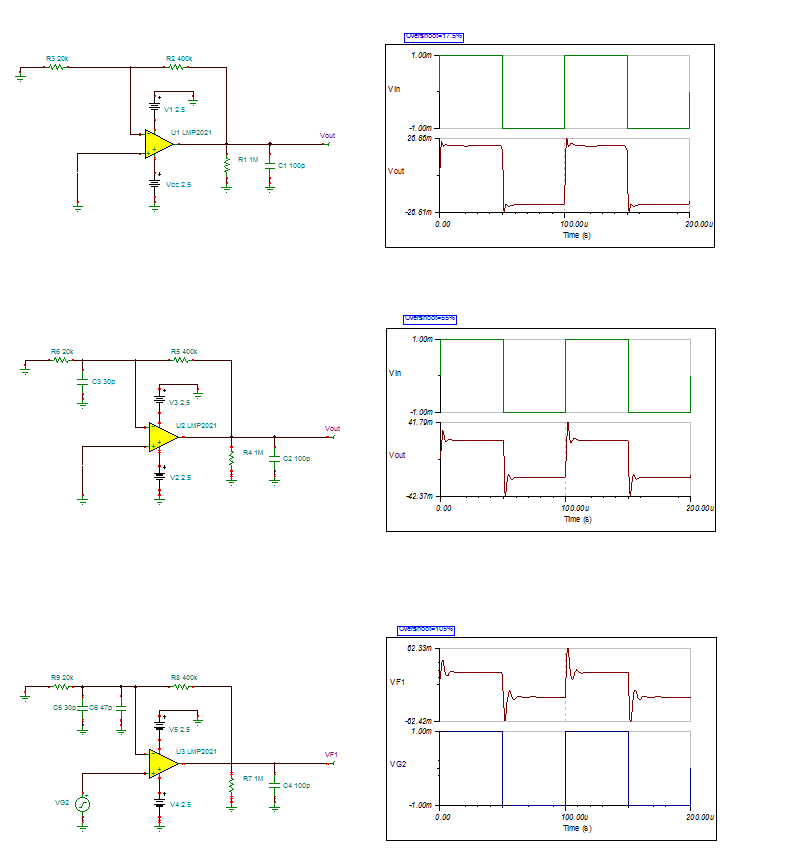
    For stability analysis, you must use a small-signal overshoot (10's of mV at the output and NOT 100mV's) - doing so, you'll get 17.5% overshoot (a very stable system) with no added capacitance on the inverting input terminal, 55% overshoot (~20 degrees of phase margin) with extra 30pF, and 105% overshoot (close to 0 degrees phase margin) with total of 77pF at the inverting input - see below:

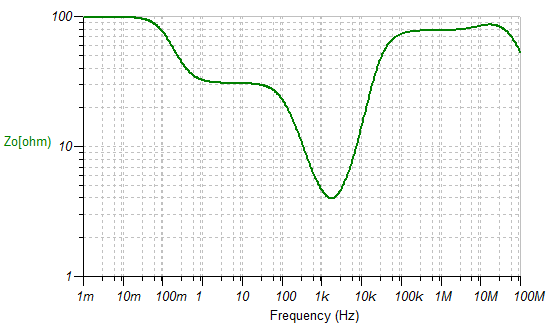
    There is no open-loop output impedance vs frequency curve in the LMP2021 datasheet but you may simulate it - see below:

    Andy LMP2021.TSC

  • Hi Marek ,

    Thank for your reply!

    I have a further question, when  added capacitance with total of 77pF at the inverting input

    it will get 105% overshoot (close to 0 degrees phase margin).(fig 1.)

    figure 1.

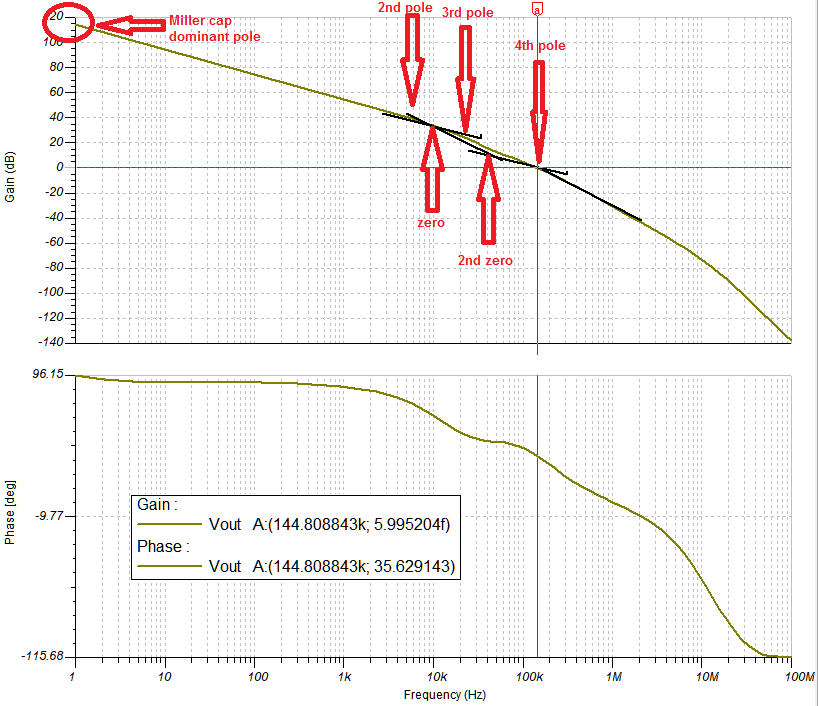
    But when do the stability simulation with AC response and check the phase margin, 
    the phase margin is about 35 degrees(fig 2.), it different from the transient result. what cause this different?

    figure 2.

  • Andy,

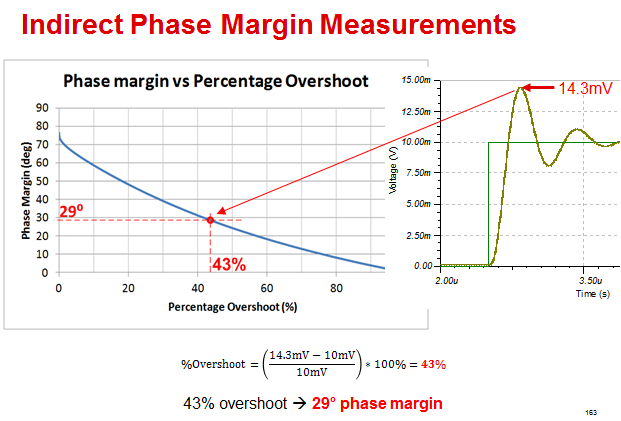
    The graph of Percent Overshoot vs Phase Margin applies only to a second order system (two-pole system - Miller cap and Ro||Cload) - see below - and that's the reason why small-signal overshoot does not correlate with the simulated phase margin in your application.

    If you look at the graph of LMP2021 Aol*β loop-gain in your circuit (see below), you'll notice multiple poles-zeros pairs, which invalidate the connection between the percent overshoot and phase margin.  Thus, with 35 degrees of phase margin the system is marginally stable though you may expect significant ringing before output settles down. 

  • Andy

    We haven't heard back from you so we assume this answered your questions. If you need more help just post another reply below.

    Thanks
    Dennis