This thread has been locked.

If you have a related question, please click the "Ask a related question" button in the top right corner. The newly created question will be automatically linked to this question.

What is the layout of debug components on Sitara AM335x devices?

I would like to know the following:

- What is the secondary TAP index in IcePick for CoreSight TAP? It was 3 on some OMAP devices.

- Memory map for CoreSight components? What are the addresses of System Debug, ETM, TPIU, ETB, etc.?

- Is ROM Table implemented at all?

- Is there an ETRM document for this devices?

  • Hi,

    I will forward your questions to the factory team, but response will be delayed due to holidays in the US.

  • Primoz Alic said:

    - What is the secondary TAP index in IcePick for CoreSight TAP? It was 3 on some OMAP devices.

    The Subarctic (AM335x) debug system is pretty much copy-pasted from Netra (DM816x), whose TRM has a pretty decent chapter about debug functionality.  Since the many video-processing cores of Netra are absent, TAP ids 1-10 are unused on subarctic.  11 is the wakeup-M3, 12 the main coresight DAP.

    The ICEPick debug core ids are 0 for the cortex-a8, and 1-2 for the PRUSS cores.

    Primoz Alic said:

    - Memory map for CoreSight components? What are the addresses of System Debug, ETM, TPIU, ETB, etc.?

    See the "Debug" tab of my centaurus/subarctic memory map spreadsheet.

    Primoz Alic said:

    - Is ROM Table implemented at all?

    It is present but completely blank on all omap4-generation devices it seems.  Also, the ROM tables for embedded cortex-M3s tend to have incorrect contents (claim presence of debug peripherals that are in fact absent).

  • More detailed posts about subarctic debug functionality (and a rant about the blank rom tables) can also be found in this thread.  Some other debug/trace related bits and pieces of info here and here.

  • Hi,
    This info did help somewhat. I have changed my code to force components addresses. I can read component ID registers but unfortunately I'm still unable to access CortexA8 core debug registers.
    I did set the DEBUG bit 13 in IcePICK core register 0 (at 0x60). There is additional power control module that needs to be configured on some OMAP registers (DAP_PC). Might this also be the case here? And if so what and where is it?

    WBR
    Primoz
  • Did you read the power/reset status register (offset 0x314 in a8 debug regs, i.e. APB address 0x80001314) first to clear the power-loss flag?  As long as this flag is still set, access to almost any other cortex-a8 debug register will result in an access fault.  (See e.g. section 12.4.21 Device Power Down and Reset Status Register of the cortex-a8 TRM for more details)

  • Yep. That's the first thing I do and it fails with sti(n)cky error from DAP.
    Does CortexM3 also need to be powered up? I'm currently skipping it's TAP and IcePICK Core register.
  • Nope, TAP 12 is all you need.  I've made a transcript of a little test, cleaned it up and tried to format it (hopefully) as readable as possible. The colons separate bitfields, dashes represent irrelevant/indeterminate data, and dr-commands first list the data shifted out of the device and then the data that was shifted in, since this makes the pipelined commands that DAP and ICEPick use easier to follow. I'm hiding icepick from the chain just to keep the rest of the transcript more concise, it's not of any importance.

    idscan -> 1:b944:02f

    ir<6> 7 (connect)
    dr<4:4>  0:6 > 8:9

    ir<6> 2 (router)
    dr<8:24>  --:------ > ac:002048       request tap 12 power and clock
    dr<8:24>  2c:08202f > 00:------       (tap is accessible and already active)
    dr<8:24>  --:------ > ac:002148       prep to select tap 12
    dr<8:24>  2c:08202f > 00:------       ok
    dr<8:24>  --:------ > 82:0359a5       prep to hide icepick
    dr<8:24>  02:000000 > 00:------       ok
    ir<6> 3f (bypass)
    run<1>                                execute!

    idscan -> 3:ba00:477

    ir<4> a (dpacc)
    dr<32:3>  --------:2 > 50000032:2     write dp-csr: power up and clear errors
    dr<32:3>  50000000:2 > --------:3     read dp-csr: confirm power up
    dr<32:3>  f0000000:2 > --------:7     ok

    dr<32:3>  --------:2 > 01000000:4     write apsel: select APB-AP
    ir<4> b (apacc)
    dr<32:3>  --------:2 > e3000012:0     configure AP
    run<1>

    dr<32:3>  --------:2 > 80001314:2     write address
    run<1>
    dr<32:3>  --------:2 > --------:7     start read
    ir<4> a (dpacc)
    dr<32:3>  0000000b:2 > --------:3     result 0b1011 (if no err), check for errors
    dr<32:3>  f0000000:2 > --------:7     ok

    ir<4> b (apacc)
    dr<32:3>  --------:2 > 80001fb8:2     write address
    run<1>
    dr<32:3>  --------:2 > --------:7     start read
    ir<4> a (dpacc)
    dr<32:3>  000000ae:2 > --------:3     result 0b10101110 (if no err)
    dr<32:3>  f0000000:2 > --------:7     ok

    I made it a bit too minimalistic since I forgot to write debug core register 0, so the value I'm reading shows no DBGEN, but the reads themselves are working fine.

    One thing occurred to me though, this test is with a very basic baremetal program running.  Are you trying to attach to a running linux system?  Since this thread I linked to earlier mentions that linux in its eagerness to turn off unnecessary clocks also manages to disable DAP.  I'm pretty sure icepick is supposed to be able to force necessary power and clocks on regardless of the PRCM settings done by software, but it apparently that's not the case on subarctic.

    Edit: added run-cycle between consecutive AP accesses that got lost in cleaning up the transcript (you'd get a WAIT response without them).

  • OK. A bit cryptic but I get it :). Except 'run<1>'. Do you mean Run-Test/Idle JTAG state?
    I'm down to physical lines now but having problems with logic analyzer... Anyway I'll check if my scans are really like that.

    And sorry, I was wrong before. I do PRSR read after reading all components CoreSight ID regs (successfully). I'll recreate your procedure now.

    Also I noticed some differences in how we do SDTAP register accesses. Is 'router' to 'run' sequence all there is? How do you repeat DR scan? Do you exit from Update-DR with TMS high?
    And one last thing, sanity check, JTAG chain is reconfigured according to SDTAP regs writes after 16 cycles in Run-Test/Idle right?

    And, yes, I'm working on factory programmed BeagleBone Black. I'll try to disable default boot. Can you also connect to CPU with nSRTS low? IcePICK is alive with nSRST low.

    P.
  • Oh. Forgot to ask... when would be the write to debug core register 0 in this sequence?
  • Oh dear, that awful state machine again that everybody copies into their "explanations" of JTAG, even though it only complicates things.

    Here's my view on JTAG, how I wished it was explained to me in the first place.  There are only four states: reset, command, data, and pause.  In each state you can issue certain commands (1 to 3 bits in length) by clocking them in via TMS:

    Command state has four commands:

    • 0   run/idle cycle, stay in command state
    • 10  select DR, go data state
    • 110 select IR, go data state
    • 111 reset TAP, go reset state

    Reset state only has 1 for staying in reset and 0 for entering command state.

    Data state has

    • 0  shift data bit, stay in data state
    • 10 enter pause state
    • 11 commit, go command state

    Pause state is very similar

    • 0  stay in pause state
    • 10 shift data bit, enter data state
    • 11 commit, go command state

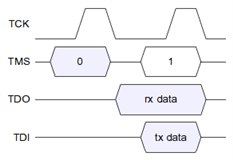
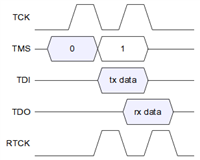
    When a shift-command is issued, the data lines get into action, but the whole thing is pipelined for natural reasons: on the (final) rising edge of TCK, the TAP has received the command and only then knows the intention for data shifting, so it prepares for data output which it begins to drive it on (or shortly after) the falling TCK edge while expecting you to do the same, and the next TCK rise it will capture your data.  It will of course also capture TMS thus the cycle can repeat.  Diagrams for very leisurely spaced clocks versus very high speed where the roundtrip delay becomes a major deal (also showing RTCK there for emphasis):

    (Understanding JTAG was for me a big "that's all? why did they have to explain it so complicated?" moment...)

    So, to answer your question,

    Primoz Alic said:
    OK. A bit cryptic but I get it :). Except 'run<1>'. Do you mean Run-Test/Idle JTAG state?

    run<1> means a single run/idle cycle in this scheme.  Since it's common to issue a multiple consecutive run/idle cycles, I include an explicit count. In this case however, a single run command is all that's needed to make ICEPick execute the prepared changes to the TAP chain.

    Primoz Alic said:
    And sorry, I was wrong before. I do PRSR read after reading all components CoreSight ID regs (successfully). I'll recreate your procedure now.

    The coresight ID regs are safe to read before PRSR: of course you need to identify a component as being the cpu debug registers to know there's a PRSR there at all.  You can access identification regs, authentication/lock registers, and claim tags. Anything else will fault as long as bit 1 of PRSR is set.

    Primoz Alic said:
    Also I noticed some differences in how we do SDTAP register accesses. Is 'router' to 'run' sequence all there is?

    I deliberately tried to find a simple-as-possible sequence that shows successful reads.  Normally it's a good idea to explicitly configure the icepick control register, which I skipped here, and do a bit more checking for robustness. Also, after setting bit 3 on the TAP you're supposed to await acknowledgement before selecting the tap, and it might be necessary to explicitly re-read the register for that (but I'm not sure about that).

    Primoz Alic said:
    How do you repeat DR scan? Do you exit from Update-DR with TMS high?

    I'm so glad I don't have to do mental exercises involving "exiting from Update-DR state" or such anymore since I noticed the much much simpler equivalent mental model summarized above. :-)

    Primoz Alic said:
    And one last thing, sanity check, JTAG chain is reconfigured according to SDTAP regs writes after 16 cycles in Run-Test/Idle right?

    I have no idea what you're officially supposed to do; my knowledge entirely comes from public sources, and they are annoyingly scarce. My experience is that a single run command suffices to make ICEPick execute its deferred changes (such as tap selections) [Correction: I misread my code; while a single run cycle apparently suffices in this case, it does not suffice in general, e.g. when ICEPick is left in the chain], and I typically run my tests at the max speed of the XDS100v2 hardware (30 MHz, well in excess of what the target's datasheet claims as maximum rate, but the eye diagram is clean and it appears to work perfectly). I'm not a big fan of ritualistically inserting lots of run/idle cycles without a clear reason for it.  However, my code is just a personal project (born out of annoyance with both CCS and OpenOCD) and still in the phase of doing small tests.  For production code, a "better safe than sorry" attitude may be more appropriate. :-)

    Primoz Alic said:
    And, yes, I'm working on factory programmed BeagleBone Black. I'll try to disable default boot. Can you also connect to CPU with nSRTS low? IcePICK is alive with nSRST low.

    ICEPick is alive, but the interconnects are held in reset, including the debug interconnect, so you query ICEPick's version number and that's about it.  At the same time, since it's a warm reset I don't think it necessarily resets all relevant PRCM settings.  You can however boot in wait-in-reset mode by powering on with EMU0 held low, or if there's a suspicion that linux is messing up PRCM settings needed for debug, just press any key via the serial console immediately after power up to pause in u-boot (or just try to connect via jtag fast enough after power on, you'll have a few seconds at least.

    I think you can also wipe the eMMC from u-boot... a bit heavy-handed solution maybe ;)

  • Primoz Alic said:
    Oh. Forgot to ask... when would be the write to debug core register 0 in this sequence?

    Well, as I mentioned I forgot to include it, but it can go basically anywhere.  Even without if you should still be able to *access* the debug registers, but you'll be limited to non-invasive debug (e.g. you can configure trace) since DBGEN won't be asserted.  Conversely, if you'd want to do monitor-mode debugging (rather than halting debug) and have another way to communicate with the debug monitor than JTAG, then setting the debug bit on core register 0 is the only step that nevertheless still needs to be done via JTAG.

    Note btw that if using wait-in-reset by holding EMU0 low then you need to be a bit careful with the value written to debug core register 0 to avoid prematurely releasing it.  You'll find it has its reset control (bits 14-15) set to 1 (wait-in-reset) and its "module reset" bit (17) set.  The reset control value must be preserved, but bit 17 is write-1-to-clear (in this case) and must therefore be written as zero.

  • I noticed a mistake in my DAP interaction: I switch to DPACC immediately after issueing an AP command to check the sticky error bit (seriously ARM, why the hell aren't there separate "OK" and "FAULT" responses instead of "OK/FAULT"?!), but this means that I don't have confirmation yet that the AP command has actually completed.  While this is probably no problem with registers of the AP itself, it definitely is an issue with the actual memory read. [Edit: never mind, the interaction is fine. Somehow I briefly thought DP accesses wouldn't give WAIT responses; they do.]


    Apart from that, some after-thoughts on my exposition of JTAG:

    The only reason pause state exists at all is to accomodate debug/test equipment which is continuously clocked and has no way to gate TCK to the device.  Most debuggers afaik generate TCK themselves so the concept of pause can be ignored entirely.  This means you can avoid thinking about separate states entirely and just view { select dr/ir, one or more data shifts, commit } as a single command. This is precisely what I mean with dr<len> and ir<len> in my transcript.

    As for this diagram:

    Matthijs van Duin said:

    Note that this much roundtrip delay, with RTCK being 180͏° out of phase with TCK, is quite extreme. In this case you obviously cannot sample TDO on the rising edge of TCK as the JTAG spec requires, though sampling on the falling edge of TCK or the rising edge of RTCK will work fine.  This timing is what I observed when operating at 30 MHz (on a custom DM814x based board), and may explain why they specified a much lower max clock rate in the datasheet.  Pretty picture to go with it (this is with ICEPick's "advance RTCK timing" option disabled, its default setting):

     (click for full size)

    (At least some of the cross-talk-like "wobble" is due to measurement error, possibly because I connected the ground leads of the probes together to a single ground of questionable quality.)

  • Hi, uff... this is way past where I am. But can confirm that TDO sometimes has behavior as you describe. I have always accredited this to internal delays and didn't go above lowest JTAG freq specified in all related documentation for some part.


    I'm running at 1MHz for these test purposes. I'm still getting sticky error on PRSR read.


    P.

  • Primoz Alic said:
    Hi, uff... this is way past where I am. But can confirm that TDO sometimes has behavior as you describe. I have always accredited this to internal delays and didn't go above lowest JTAG freq specified in all related documentation for some part.

    I'm running at 1MHz for these test purposes.

    If by the TDO behavior you mean the delay from TCK to TDO/RTCK, that's definitely just internal (gate+wire) delays when only ICEPick and/or one or more DAPs are in chain. The ~15 ns I saw on the scope is quite reasonable for that. Things are different of course when an older (pre-Cortex) ARM core is in the chain since then there would be additional delays due to resynchronization to the core's clock (adaptive clocking is typically used in that case to ensure reliable operation).

    Primoz Alic said:
    I'm still getting sticky error on PRSR read.

    And the more I think about it, the more mysterious this becomes... since you mentioned you can read the identification registers, which means you've succesfully reached the cortex-a8 debug APB, and if you get that far you should always be able to read PRSR. I have also had no trouble reading it in any of my tests.


    BTW,

    Matthijs van Duin said:

    And one last thing, sanity check, JTAG chain is reconfigured according to SDTAP regs writes after 16 cycles in Run-Test/Idle right?

    I have no idea what you're officially supposed to do; my knowledge entirely comes from public sources, and they are annoyingly scarce. My experience is that a single run command suffices to make ICEPick execute its deferred changes (such as tap selections)[/quote]

    Actually it turns out a single run cycle only sufficed due to removing ICEPick from the TAP chain: I noticed in my source code that I did issue multiple run cycles when I left ICEPick in the chain, and a quick test revealed it really does need them (4 to be precise). I guess it's better to stay on the safe side and perform 16 run cycles (or more) after all ;-)

    Also, a run cycle is needed between consecutive AP accesses to avoid a WAIT response; these accidently got lost from my transcript while cleaning it up, I've reinserted them now.

  • Primoz Alic said:
    I'm running at 1MHz for these test purposes. I'm still getting sticky error on PRSR read.

    Is there perhaps any way to get a low-level trace of what's really going on at the JTAG level?  (If your hardware happens to be FTDI-based like the XDS100v2 and many other JTAG adapters then a USB packet trace would also do the trick... I should still have some scripts (somewhere...) that convert a USB packet log into a reasonably readable JTAG transcript)

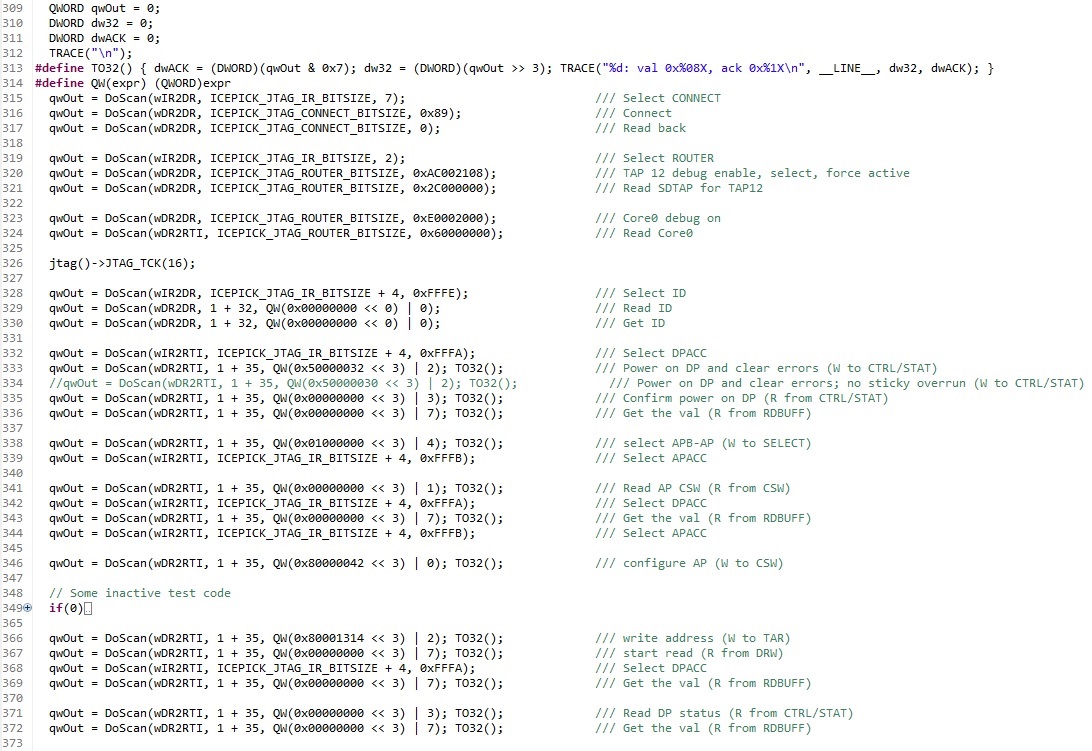
  • I have a cheap logic analyzer which makes making of presentable recordings uneasy. Anyway, it might not be needed. I finally have a working initial JTAG sequence. I can't really tell what exactly was wrong (bunch of small things like typos in scan length). But final catch was going through, and you won't like this :), Run-Test/Idle JTAG state for each CoreSight scan. Below is the screenshot of my code and generated trace with line numbers. FYI: DoScan function takes scan path flags in first parameter. E.g. wIR2DR means "do IR scan and return to SelectDR (with TMS high from Update-DR)", while wIR2RTI means "do IRscan and return to Run-Test/Idle".

    Output from TO32 macro. First column is the corresponding line number (that's why a screenshot).

    333: val 0x00000000, ack 0x2

    335: val 0x50000000, ack 0x2

    336: val 0xF0000000, ack 0x2

    338: val 0x00000000, ack 0x2

    341: val 0x01000000, ack 0x2

    343: val 0x80000042, ack 0x2

    346: val 0x00000000, ack 0x2

    366: val 0x80000042, ack 0x2

    367: val 0x80000042, ack 0x2

    369: val 0x0000000B, ack 0x2

    371: val 0x00000000, ack 0x2

    372: val 0xF0000000, ack 0x2

  • Primoz Alic said:
    I have a cheap logic analyzer which makes making of presentable recordings uneasy.

    That's why I wondered if your JTAG adapter happened to be based on the popular FT2232H (or similar), since it's easy to capture USB traffic (on both linux and windows) and I have scripts that can interpret such traffic and present it as JTAG scan sequences (with colorized output even). :-)

    Primoz Alic said:
    Anyway, it might not be needed. I finally have a working initial JTAG sequence. I can't really tell what exactly was wrong (bunch of small things like typos in scan length). But final catch was going through, and you won't like this :), Run-Test/Idle JTAG state for each CoreSight scan.

    Well I did mention, a bit late, that a run-cycle is needed between consecutive AP accesses to avoid a WAIT response (ack = 0x1). Or to be more precise, what it needs is a rising TCK edge to dispatch the request (regardless of whether this takes you to Run/Idle or not) and some time for the request to complete before capturing DR again. If you don't leave enough time (fast jtag clock and/or slow target) you'll get a WAIT response even with the run cycle. Merely performing the select-DR very slowly doesn't suffice probably because DAP will need two TCKs to resynchronize the response and by then you're capturing DR already (which interestingly will contain the correct response data in that case, regardless of the WAIT status). Going through run/idle state is itself not important though, you can perform an IR scan instead.

    But still, you said you were getting an error... a WAIT response is not an error and software should be prepared to deal with them anyway since it's always possible transaction takes more time than expected if the request or its reply happens to get stuck in heavy traffic (though I'll admit that's less likely on the L4_EMU interconnect to which the APB-AP connects than on the L3 to which the AHB-AP connects).

    I see however you enabled sticky overrun (but hadn't quite decided yet, considering the commented line 334).  If you're synchronously waiting for responses then you should definitely not do so: just check for WAIT and retry.  It's meant to allow better performance with higher-latency JTAG adapter where waiting for responses consumes most of the time (e.g. dumb USB JTAG adapters) by allowing you to blindly send multiple transactions under the assumption you won't get a WAIT response; if one does occur, flagging it as an error causes all subsequent transactions to be ignored. If the WAITed request was a read, the first OK/FAULT response after that still contains the response data.  The downside is that after getting a WAIT response you'll need to clear the sticky overrun in DAP CSR, but you need to visit that register periodically anyway to check for errors. This usually only needs to be once per batch of transactions: if an access error occurred, then after clearing the error you can read the Mem-AP's address register to see the address of the failed read/write (if a batch contains multiple accesses to the same address and you need to know which one failed you'll need to insert checks for errors in between).

  • Matthijs,

    Thank you for all the information!

    Also my boss wants to thank you more than just with words, so if you send me your address, he’ll have some goodies sent to you.
    You can reach me at primoz.alic@isystem.si.

    WBR
    Primoz