This thread has been locked.

If you have a related question, please click the "Ask a related question" button in the top right corner. The newly created question will be automatically linked to this question.

DAC5675A: Spurs at DAC output

Part Number: DAC5675A
Other Parts Discussed in Thread: DAC5675, CDCM7005, , DAC3174

Hello,

We use DAC5675 on a custom designed card. But we have a problem with our card. I want to explain the problem.
We drive the DAC5675a with a frequency of 360mhz from CDCM7005. And we think we provide the setup / hold values of the digital interface. To test the dac, we create a single tone and look at the dac's output. We see spur at the outputs of the dac according to the frequency of the single tone what we create at the output of the dac. As an example: When 240mhz single tone signal is created to output, we dont see spur. But when we output a single tone signal of 241mhz we see spurs.
We are a little inexperienced with data converters. I am open to all help on what spurs may be caused by.

Thanks in advance.
Canberk

  • Canberk:

    I am not sure of the number, frequency location and amplitude of the spurs that you are referring.  A screen shot may be helpful to analyze as there are a certain amount of spurs that are expected.

    Your frequency / clocking set-up is a bit unconventional.  If you are sampling at 360 MHz then the 1st Nyquist operation is to 180 MHz.  You can reasonably output tones up to that frequency.  At 240 MHz you are squarely in the 2nd Nyquist zone.  I would expect the tone at this frequency to be significantly attenuated due to the sin(x)/x roll-off in the higher Nyquist zones.

    The first Nyquist zone image will land at (360 - 240 =) 120 MHz.  The second harmonic is at 480 MHz.  It's 1st Nyquist image falls at (480 - 360=) 120 MHz.  Exactly the same.  The point is that the input frequency and sampling rate of choice happens to have all of its harmonic components fold back on top of each other.  I suspect that this is giving you the false impression of no spurs.  When you offset by a bit, then you can see all the harmonics/images separated.

    For your application, I recommend operating with a higher sampling rate DAC (like DAC3174) or reducing your tone to below 1st Nyquist zone.

    --RJH

  • Firstly, thank you for your reply.

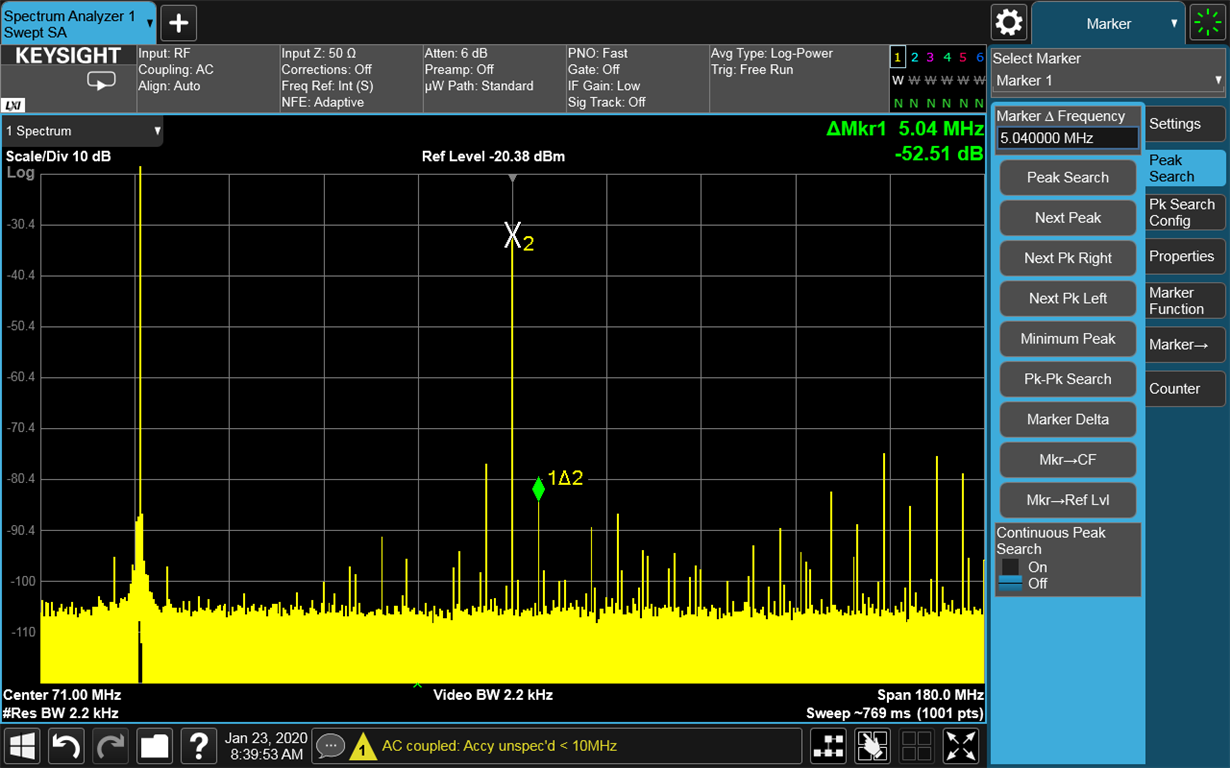
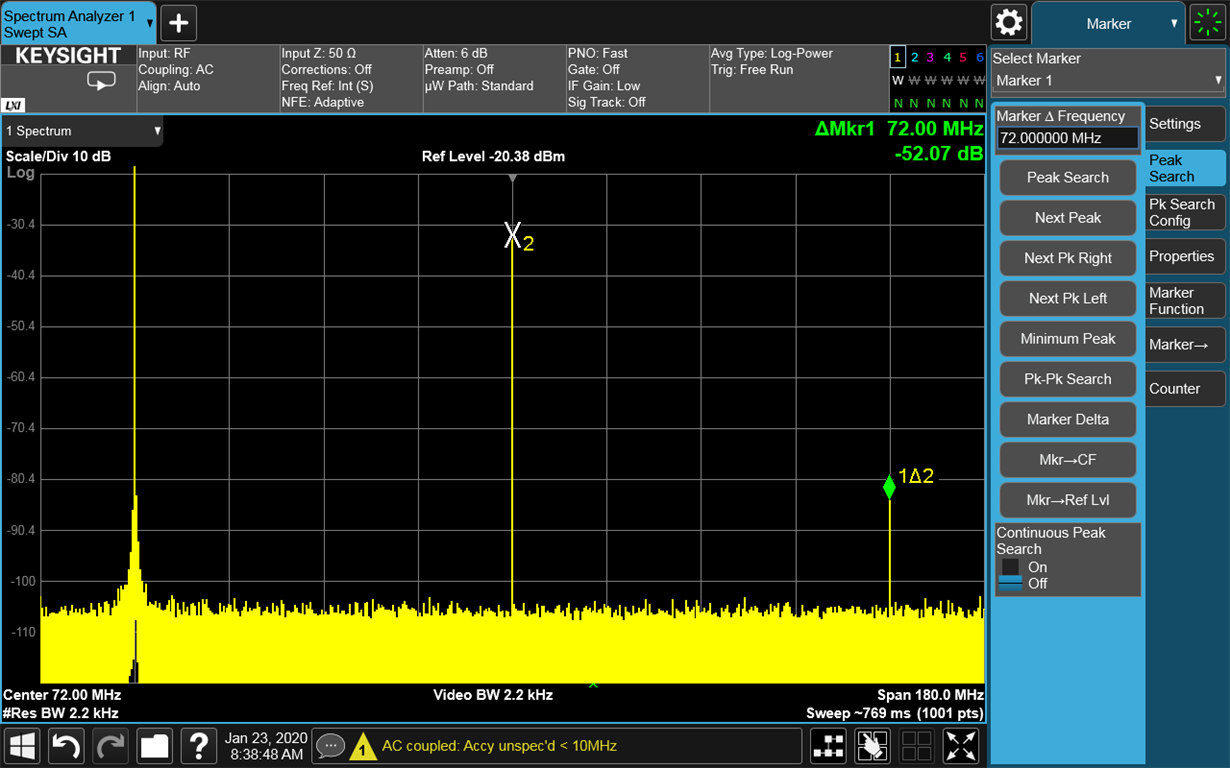
    To be as you mentioned: i create single tones at 72 MHz and 71 MHz in first Nyquist zone. But again we are faced with same situation. We dont see spurs on 72 MHz ;but on 71 MHz we see spurs. This behavior is not only specific to 71 MHz or 72 MHz. Same situations appears with some specific frequncies for example : 10 MHz, 20 MHz, 24 MHz, 30 MHz, 40 MHz, 45 MHz, 48  MHz.... i can ss for these frequencies too.

    **I am adding secreen shots for 71MHz and 72 MHz.

    Thnaks in advance.

    Canberk

  • Canberk:

    The screenshots are helpful.  As you report, the 72 MHz looks clean with only an expected HD2 component while the 71 MHz has many spurs.  One thing that looked strange to me is the output power.  It looks roughly to be -32 dBm and that seems too low.  What is the hardware configuration?  Are you using the TI EVM with the TSW1400 as a pattern generator?

    The spur pattern sort of has the indication of being on a code threshold area.  This could be if the pattern file is very low (i.e. not all of the DAC codes are exercised).  I am not sure why 72 would be good and not 71 MHz unless there is a relationship between frequency and sampling clock.  As an experiment, you can try to adjust the sampling clock by 1 MHz (if possible) and see if the 72 MHz is no longer "good".  Also verify the clock frequency is meeting amplitude expectations.  There are losses on the board/transformer that need to be compensated for.  Generally no fear in increasing clock amplitude.  Also double-check the voltage at the board and current consumption.  If a low voltage is getting to the board or if the supply is current limited then some weird things can happen.

    --RJH