This thread has been locked.

If you have a related question, please click the "Ask a related question" button in the top right corner. The newly created question will be automatically linked to this question.

Error message observed during launching project through debugger

Other Parts Discussed in Thread: DAC8564

Hi,

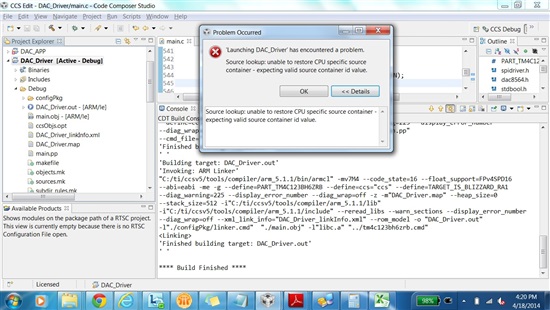
I am working on a project in which I am trying to test the DAC8564 driver and when I right click on my project and click "Debug As Code Composer Debug Session" the debugger starts to launch, but then I get the following error message:

I'm seeing CCS 5 error message when I try to start debugging the applications for my TIVA target board. 

I am using TI XDS100v2 USB emulator for debugging and processor is TM4C123BH6ZRB. Have anyone got that type of error message and if yes can you give me the reason why such message comes and how to resolve the same.

I am able to debug all other projects. Please advise what I can do get this fixed. Also please let me know should anyone require any further information.

Thanks

Mritunjai

  • Hi Mritunjai,

    Delete the above project -> Create a new workspace and then try importing the above project there.

    Let us know what you observe.

    Regards,

    Gautam

  • Thanks Gautam,

    I will try as you suggested and let you know the result.

    Regards,

    Mritunjai

  • Hi Gautam,

    I tried what you suggested i.e. Deleted the project from current work space and the importing the project in new work space and also deleted the Debug folder and when I tried to launch the application after successful compilation, it gives me the same error message (:

    Can you guide me to resolve this issue.

    Regards,

    Mritunjai

  • As you previously said that other projects are working fine and only this project is creating an issue. Can you create a new project and just import the c file or copy your code to main.c ?

  • Mritunjai Singh said:

    I am working on a project in which I am trying to test the DAC8564 driver and when I right click on my project and click "Debug As Code Composer Debug Session" the debugger starts to launch, but then I get the following error message:

    Do you have a target configuration file (.ccxml) added to your project? If so, can you attach the file here for us to take a look at? Have you tried clicking on the "green bug" icon which should also launch a debug session? Does it generate the same error?

    Also since you mentioned the problem is only seen for this project, also try the troubleshooting steps mentioned here: http://processors.wiki.ti.com/index.php/Troubleshooting_CCSv5#Debugger


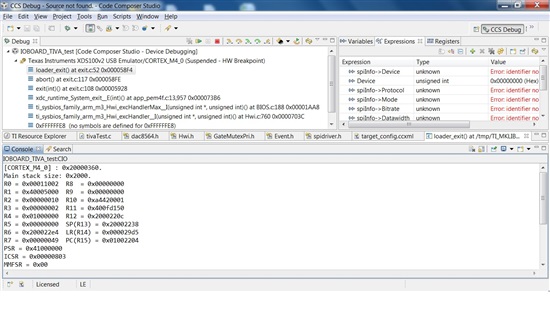
  • I have resolved the issues thanks @Gautam, Now I am facing another issue when I launch my application dump for which is pasted below which I am seeing on console:

    [CORTEX_M4_0] : 0x20000360.

    Main stack size: 0x2000.
    R0 = 0x00011002 R8 = 0x00000000
    R1 = 0x40005000 R9 = 0x00000000
    R2 = 0x00000010 R10 = 0xa4420001
    R3 = 0x00000002 R11 = 0x400fd180
    R4 = 0x01000000 R12 = 0x2000220c
    R5 = 0x00000000 SP(R13) = 0x20002238
    R6 = 0x200022e4 LR(R14) = 0x00002bb1
    R7 = 0x00000049 PC(R15) = 0x01002204
    PSR = 0x41000000
    ICSR = 0x00000803
    MMFSR = 0x00
    BFSR = 0x82
    UFSR = 0x0000
    HFSR = 0x40000000
    DFSR = 0x00000000
    MMAR = 0x4000552c
    BFAR = 0x4000552c
    AFSR = 0x00000000
    Terminating execution...

    Can you guide me why this error message is coming.

    Regards,

    Mritunjai

  • Screenshot capture of the error

    Regards,

    Mritunjai

  • This type of dump can occur when the processor encounters a fault, which can happen due to a number of reasons. Here are some similar threads that might be helpful:

    http://e2e.ti.com/support/microcontrollers/tiva_arm/f/908/t/290322.aspx
    http://e2e.ti.com/support/microcontrollers/stellaris_arm/f/471/t/304484.aspx

    I would suggest starting a new thread in the Tiva Microcontroller forum as they may have some more specific guidelines to debug the reason for the fault.

  • Thanks AartiG,

    I am still not able to figure out after looking to the threads you suggested. I event try changing the stack size to maximum, still this issue kept coming and I am wondering sometimes its get resolved itself. So the behavior is strange, sometimes it is coming and sometimes not.

    Can you explain me in more detail why such error occurs, so that I can try those resolutions.

    Regards,

    Mritunjai 

  • Mritunjai,

    As I mentioned earlier the experts in the Tiva Microcontrollers forum will have more expertise and knowledge about the hardware aspects and can provide better details as to what could cause these types of errors. Please start a new post in that forum.

  • Mritunjai Singh said:
    R6 = 0x200022e4 LR(R14) = 0x00002bb1
    R7 = 0x00000049 PC(R15) = 0x01002204

    The Program Counter (PC) value of 0x01002204 is a reserved address according the the Memory Map in the TM4C123BH6ZRB datasheet. Therefore, attempting to execute code from that address will generate an exception. What ever function is at the Link Register (LR) address 0x00002bb1 in flash may give a clue.

    Further investigation is needed to determine if the crash is due to memory being corrupted or an invalid pointer. Can you single step to see at what point the exception occurs?

  •  Hi, I remember I lost a week investigating what can be worst but code was ok, I raised stack to huge but nothing was changing, I inspected stack deep and all appeared good to me ...

     At last I discovered stack on project was set in two point, the only one was cahnging stack was the project property and this is set by default to some small 512 bytes. Where you defined stack size on file or property?

  • Hi Robert,

    Sorry for late reply, I have set the stack size to 4096 in the project properties and you are right it was earlier set to 512 by default. Neverthless I will post this thread to the forum as suggested by ArtiG.

    Regards,

    Mritunjai