This thread has been locked.

If you have a related question, please click the "Ask a related question" button in the top right corner. The newly created question will be automatically linked to this question.

CCS gragh real-time showing problem

Expert 2985 points

Hi all,

I met a problem with the graph tool's real-time showing in CCS.

**********************************************************************************************

In our board, the FPGA sends 400 Bytes data to the C6670 through SRIO port every 1.5ms.

After sending, the FPGA raise one of the C6670's GPIO to notice the C6670 that the transfer is done. (We haven't try to use doorbell right now.)

In C6670's GPIO interrupt func, the core moves the 400B data to the other buffer with 4K Bytes size.

So the 4KB section will be re-wrote every 1.5ms and every 15ms it will be refreshed toally.

**********************************************************************************************

In the CCSv5.3, I use the Graph--Single Time tool to show the waveform of the data in 4KB section.

If the FPGA sends sin waveform, the tool can show OK. But sometims I got the wrong waveforms like below.

**************************************************************************************************************

And I quote the reply from  in this thread http://e2e.ti.com/support/development_tools/code_composer_studio/f/81/t/189193.aspx,

I think his reply is right.

**************************************************************************************************************

But how to fix this showing problem?

How to use the CCS to show the waveform of the data in one memory section with continuous refresh?

How to avoid the real-time data to be refreshed by the new data and accessed by the graph tool in the same time?

Maybe FIFO can resolve this problem, but can I use a FIFO for common use in Keystone DSP?

**************************************************************************************************************

Appreciating for any repiles.

Thanks!

Feng

  • Feng,

    A while ago I filed a bug against CCSv5 about missing samples but it was supposed to have been fixed by the time CCSv5.3 was released.

    However, looking at your description I see you are trying to use the continuous refresh. In this case, I am almost sure this effect is being caused by the fact the rate of graph updating in CCS and the routine that fills the buffer are completely asynchronous. That and the fact that the continuous refresh also needs to set a breakpoint to transfer the buffer data to the graph view, which could be causing the data disruption as well.

    This effect would be eliminated if you put a breakpoint at a well known place in your code where the buffer is guaranteed to be full with valid data. Given the amount of data to be transferred from the buffer to CCS is large (4kB through a slow connection such as JTAG will take some time to complete), that would be your option to properly see the data. Keep in mind the breakpoints will likely disrupt your real-time processing, but there is no way to workaround that.

    Instead of a FIFO, I would use a dual buffer to display this. In other words, you fill buffer "A" first, then start filling buffer "B" while reading buffer "A". This will prevent the buffer from having corrupt data, but keep in mind the data transfer from the buffer to the graph will still interrupt the device.

    I am unsure if I fully understood the issue at hand, but please let me know if all that makes sense to your case.

    Regards,

    Rafael

  • Hi Rafael,

    Thanks for your very professional replies!

    I totally agree with your opinion below.

    desouza said:

    In this case, I am almost sure this effect is being caused by the fact the rate of graph updating in CCS and the routine that fills the buffer are completely asynchronous. That and the fact that the continuous refresh also needs to set a breakpoint to transfer the buffer data to the graph view, which could be causing the data disruption as well.

    In my case, the data is transferred from FPGA to DSP every 1.5 microseconds. The DSP can not change anything but receive the data every 1.5 ms. And the CCS's Graph tool will read the data and show its waveform asynchronously.

    As your suggestion, I can find the safe breakpoint and when the DSP is suspended the waveform is OK.

    But my real problem is that we will show our system to the third-party members who pay us to develop this system. When they change the signal generator to send the varying sin waves and they want to see that the CCS show the changing wave  at the same time. That will give them the strong confirmation that our system is OK.

    So, in one word, the 400 Bytes data has came from FPGA to DSP every 1.5 microseconds and my problem is how to use the CCS to show the data waveform correctly and continuously(not in the theory but looks like that).

    I think if I can control the Graph tool when to capture the data through JTAG from DSP to PC, that will be OK. That means after the data is coming I can order the Graph to capture the data within 1.5ms(if the JATG data throughput is above 400B/1.5ms=266KB/s) before the next data  comes and the  data disruption will not happen.

    But how to control the Graph tool? How to implement this in the codes? Are there any APIs to do this? Or how to configure the CCS's Graph tool?

    And you says that 

    desouza said:

    Instead of a FIFO, I would use a dual buffer to display this. In other words, you fill buffer "A" first, then start filling buffer "B" while reading buffer "A". This will prevent the buffer from having corrupt data, but keep in mind the data transfer from the buffer to the graph will still interrupt the device.

    it's a good way. But how the Graph tool to link two buffer like A and B as you mention in turns?

    Regards,

    Feng

  • Feng,

    About the first question, do you know how to set up a breakpoint in a way to "animate" the display of a waveform? If not, check these two pages:

    Section 6.2 of the Getting Started Guide: http://processors.wiki.ti.com/index.php/CCSv5_Getting_Started_Guide

    MSP430 Graph visualization (although old, this correlates hardware and graphs):

    http://processors.wiki.ti.com/index.php/Graph_Visualization_for_MSP430

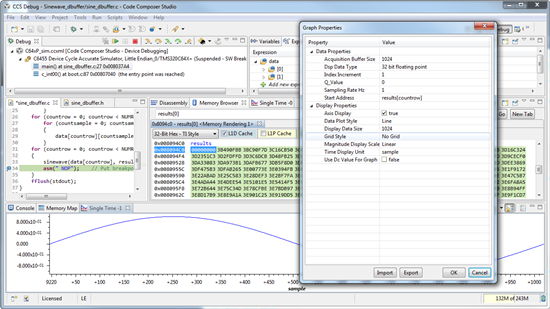
    Regarding the second question: if you define your buffer as a 2D array, you can pass the variable with the array index as a parameter. Something along the lines of:

    #define BUFSIZE 400
    #define ROWSIZE 2
    
    uint32_t countrow;
    (...) int16_t doublebuf[ROWSIZE][BUFSIZE];

    Then, the Starting Address parameter would be: doublebuf[countrow]. Keep in mind that all variables are global.

    Attached follows a small example project I modified that illustrates this double buffering scheme.

    Hope this helps,

    Rafael

    Sinewave_dbuffer.zip
  • Hi Rafael,

    Your answers to my questions are very helpful. And your description about how to set a double row buffer and configure the Gragh tool is perfect OK.

    Because of some other reasons, I can not debug my system right now. But I will check your advise about the breakpoint settings and double row buffer configuration. And then give you feedbacks quickly.

    Regards,

    Feng