This thread has been locked.

If you have a related question, please click the "Ask a related question" button in the top right corner. The newly created question will be automatically linked to this question.

Integrating XDS Debugger in to Eclipse Environment for simplelink BLE stack platform ( BLE v2.0 on CC26xx).

Other Parts Discussed in Thread: SEGGER, CC2650

Hi,

As per Query raised by me: https://e2e.ti.com/support/development_tools/code_composer_studio/f/81/t/415312

I'm able to set-up my build system using makefile under eclipse environment by using the TI provided tool chain itself. (which was taken reference from CCS)

So now I am able to generate .out, .hex, .map and able to flash the .hex using flash programmer. And now I want to debug using the debugger(XDS), can you please suggest how to proceed with integrating the debugger and run from Eclipse environment.

thanks,

Anil

  • Hi Anil,

    Integrating XDS emulator to Eclipse... I'm not sure you'll be able to do that. Though you can try installing the XDS driver package.

    Regards,
    Gautam
  • Anil - your only option is using XDS100 with GDB. See the below urls:
    processors.wiki.ti.com/.../XDS_GDB_Agent
    e2e.ti.com/.../1487831

    Sounds like you want to go with a pure Eclipse environment and not CCS. Any reason why? Just curious.

    Thanks
    ki
  • Hello Gautam and Ki,

    yes we would like to have pure eclipse with the XDS100 debugger plug-in. The base eclipse has 99% less options to mess up in the config dialogues :)

    No real reason. We used eclipse so far for all projects. would be nice to keep this like that. Its simply a preference we take now as a challenge.

    We also had the same idea, we downloaded the XDS emulation pack and used the XDS GDB Agent to connect to our target. The only problem remaining now is that the GDB clients of the GCC compilers we used for testing (GNU gdb (GNU Tools for ARM Embedded Processors) 7.8.0.20150304-cvs and some earlier versions as well) crash as soon as we would like to load the symbols from the executable which was compiled by the CCS TI ARM compiler. The TI ARM compiler in CCS studio is configured to generate dwarf debug information and actually eclipse CDT's elf executable parser can decode all the debug information without issues. We can even debug on assembler level as long as the debug information is not loaded or added to the running DBG client instance later with the add-symbol-file command. As soon as the symbols are loaded we get a gdb creash.

    Is there any way to make CCS TI ARM compiler's executables compatible with the standard arm-none-eabi elf format?

    Thanks for your kind response in advance.

    Best regards,
    Anil
  • Anil - would be possible to provide your symbol file (out file) to me? If you do not want to post it publicly, please start a private conversation with me.

    Thanks
    ki
  • Anil,

    I can confirm that GDB clients have been crashing on me with several types of executables (TI or GCC) and with multiple underlying debuggers (OpenOCD and XDS GDB Agent). I am running on a Windows host PC.

    At this point I have absolutely no idea why this is happening, but it seems an issue with GDB itself (I tested several versions included with Linaro GCC distros).

    I will keep you informed if I get any additional details.

    Regards,
    Rafael
  • Hi Ki,

    I could not launch any private conversation with you. I guess you have to allow me post something in private. can you check and let me know!.

    thanks,
    Anil Kumar. B
  • Hi Rafael,

    Any Update on using gdb client with XDS GDB agent!!

    thanks,
    Anil.
  • Anil,

    Differently than what I mentioned in my previous post, I can reproduce the GDB crash only when loading symbols of executables created with the TI compiler. All GCC executables I tested ran fine.

    Also, I saw on the web some GDB bugs related to crashes depending on the version of the debug symbols (DWARF) used by C++ executables generated by GCC compilers. Given my tests were done with plain C, I imagine our compiler is at fault.

    For that, I filed the bug number SDSCM00051842. You can check its status in the link SDOWP in my signature below.

    I apologize for the inconvenience,
    Rafael
  • Rafael,

    Issue was with the executable generated with TI compiler only, finally our requirement is to work with TI compiler. The same issue was found with us also like we are able to launch the debugging session using XDS GDB agent and GDB client but the client is crashing while loading the symbols from .out file

    I guess the problem is similar.

    thanks,
    Anil
  • Anil,

    Yes, the problem is the same.

    Let me ask you something: is this issue currently blocking your development or you are able to debug your system using a different setup?

    Regards,

    Rafael

  • Rafael,

    its blocking. we were not able to debug currently.

    thanks,
    Anil.
  • Rafael,

    Any Suggestions from your end?

    thanks,
    Anil
  • Rafael,

    In an alternate way, let me explain whatever we have tried out.
    project type: Makefile project with eclipse IDE.
    Toolchain used: IAR toolchain (as we have purchased the license for further development)

    we have collected all the required dependencies and included under eclipse makefile environment and able to generate the .out, .hex successfully. when we try to flash the .hex and check for results, its negative. so in order to find out the things we have downloaded the IAR plug-in support for eclipse environment and tried to debug the source.

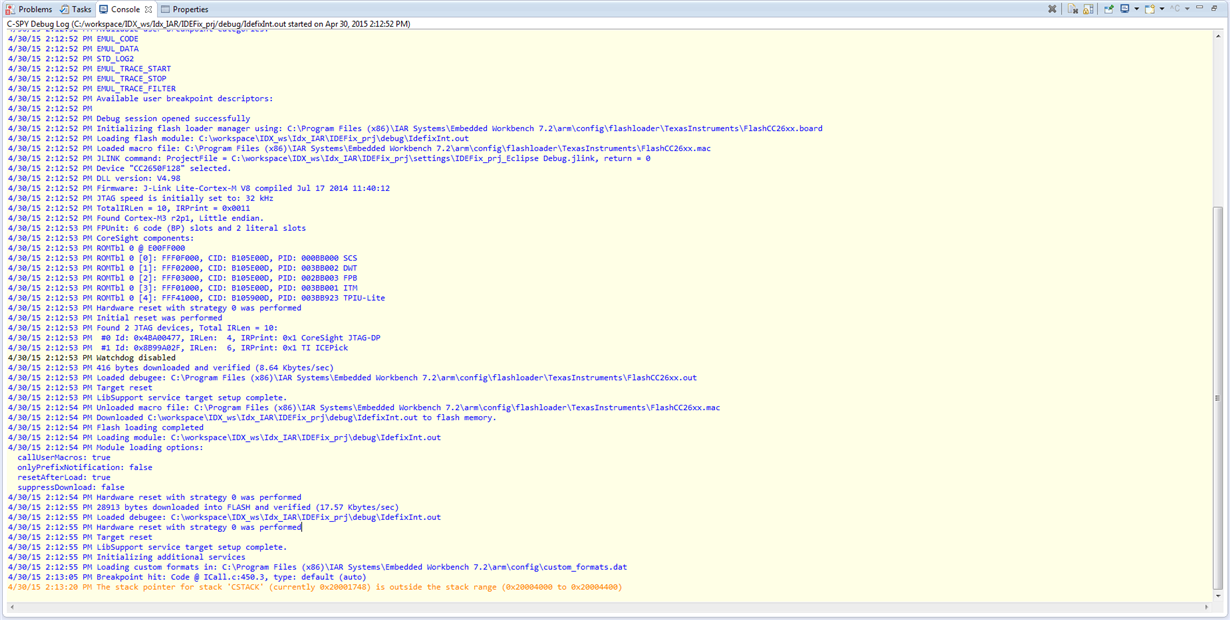
    Here successfully we were able to launch the debug session and load the symbols to debugger( here its J-Link segger, as the IAR plug-in doesn't list the XDS debugger) and debug the code on CC26XX development kit with CC2650 7X7 package evaluation module on it. now while debugging the code, we faced a situation like when the ICALL task been started the stack pointer is getting corrupted to out of range value and the system is hanging.

    this seems to be very different case as we did the same using Eclipse IDE and TI compiler tool chain and the system is running fine but here issue is we were not able to debug as we discussed above.

    And now when we moved to IAR tool chain we are facing this issue regarding stack pointer corruption in Icall task. can you please tell me whether something is going wrong? as we have observed the same project is compiling fine and working on development kit when using the IAR IDE.

    For your reference i'm attaching the screen shot taken while debugging.


    thanks,
    Anil

  • Anil,

    Thank you for sending the additional details.

    Despite I filed the issue in our bug tracking system, it will still take a while to gather the resources to investigate and mplement this added functionality to it - unfortunately there was never a requirement for our tools to be tested with open source debuggers such as GDB.

    In the meantime, I have been talking to a developer internally and he mentioned that a patch for the GDB exists and can be used as a workaround to this issue. Check the link below:

    sourceware.org/.../show_bug.cgi

    To apply the patch and rebuild GCC is not difficult, but it is a long process that will take several hours, but it may help you get unstuck. The ARM GCC toolchain sources are available at the link below:

    launchpad.net/gcc-arm-embedded

    Another alternative to help you move forward with the debugging process is to use the CCS debugger to manually connect and load your executable and symbols to the target. In this case, you can check section 4.2 of the page below for details on how to do this:
    processors.wiki.ti.com/.../Debug_Handbook_for_CCS

    If you also are not familiar with debugging directly on CCS, you can go through section 2 of the page above.

    Hope this helps,
    Rafael
  • You say you are using "GNU gdb (GNU Tools for ARM Embedded Processors) 7.8.0.20150304-cvs". From where are you getting this version of GDB? From what development branch?
  • Archaeologist,

    This release is the latest from GCC ARM Launchpad branch, available here:

    launchpad.net/gcc-arm-embedded

    This release of GDB is included in the package 4.9-2015q1 of the page above.

    Anil,

    I was able to build the tools and make GDB work with our TI compiler executables by applying the patch I sent before.

    Regards,
    Rafael
  • Okay, thanks.  SDSCM00051842 is a duplicate of SDSCM00049805 (as is SDSCM00050016).  This is not a bug in the TI compiler, it is a bug in GDB and binutils.  They incorrectly decode certain TI-specific DWARF attributes and sometimes crash.

    It is in fact the bug referred to earlier in this thread, https://sourceware.org/bugzilla/show_bug.cgi?id=16822

    The workaround is to apply the patch mentioned in the bugzilla entry.

  • Hi desouza ,

    could you please provide the executable which is builded by with that patch?
    so that we can re use the same executable with out undergoing the long build process.

    With Regards,
    Thangaraj.P
  • Hi ,
    could you please update on above request?
  • Hi,

    I apologize for the delay; are you still having trouble building the patched GDB executable?

    If so, I created a page that shows how to build GCC from its sources. Check the link below:
    processors.wiki.ti.com/.../Building_ARM_baremetal_GCC

    If you cannot spare a Linux machine or is having an overall issue, please let me know.

    Hope this helps,
    Rafael