This thread has been locked.

If you have a related question, please click the "Ask a related question" button in the top right corner. The newly created question will be automatically linked to this question.

Beaglebone Black CPI

Could anyone explain me what is wrong with instruction execution on am335x(Beaglebone black) or IDE Code Composer Studio v6 (Ubuntu 14.04)  or dubugger(Blackhawk 100v2)?

I receive strange number of cycles per instruction(CPI) while debugging code step by step. (I mean from 190 cycles per BL instruction in good scenario to 17,179,869,606 cycles per STRB instruction)  

I have tried different code locations (SRAM, L3OCMC0, DDR0) , with or without MMU & caching but still can figure out why it take so long to do simple task. 

How many cycles usually takes instruction (e.g. BL) fetched from SRAM memory?

P.S. It bare-metal tests with no Linux environment or StarterWare SDK. All configuration done by beagleboneblack.gel script (CPU 500MHz, DDR3 400MHz)

  • ROMAN MAHERA said:
    How many cycles usually takes instruction (e.g. BL) fetched from SRAM memory?

    The previous measurements in The so many delta cycles are believable? where the hardware trace analyzer was used to measure the AM335x Cortex-A8 instructions on a program running from SRAM showed:

    - Up to 200 cycles per instruction when the MMU and cache were disabled

    - A few cycles per instruction when the MMU and cache were enabled

    ROMAN MAHERA said:
    I receive strange number of cycles per instruction(CPI) while debugging code step by step. (I mean from 190 cycles per BL instruction in good scenario to 17,179,869,606 cycles per STRB instruction)  

    Can you clarify how the CPI is being measured?

    A value of 190 cycles is believable if the MMU and cache are disabled, but the value of 17,179,869,606 cycles is wrong.

  • Hi,

    As Chester mentioned, a clarification on how the CPI is measured will be useful.

    Be mindful that, if there are other peripherals configured in the system, they may be causing bus contention on the memory (a DMA transfer, for example). Also, if there are interrupts that triggered between single steps they may throw off the counter.

    The CCS profiler clock uses the ARM core event counter, therefore there is another way to count cycles that could be used to double-check this: open the Breakpoints view (menu View --> Breakpoints) then click on the small triangle close to the Add Breakpoint Button (the one with the small blue circle) and select Count Event.

    Regards,
    Rafael
  • Since Code Composer Profile instruments  for ARM are restricted to clock only, I just count clocks while stepping through assembly code. (system configuration done by .gel script, no DMA and no interrupts configured)

    Well, at least I have 190 cycles per instruction with MMU and caching are OFF. I believe 17,xxx,xxx,xxx number appears due to some OS/CSS/Debugger communication faults

    Thank you 

  • Hi,

    I have been testing a few things on Beaglebone and I really did not hit this enormous number of cycles between single Assembly steps - typically ~180 cycles with baremetal code/no MMU/no cache.

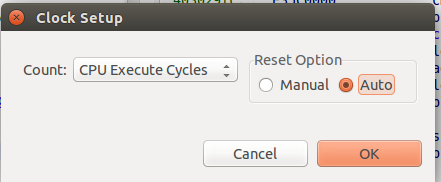
    What does happen if you enable the Auto reset option of the profiler clock? To enable, go to menu Run --> Clock --> Setup and set it as below:

    At this point I can't do much more than keep trying to reproduce this issue here or keeping an eye on any similar reports from other developers.

    Regards,

    Rafael