This thread has been locked.

If you have a related question, please click the "Ask a related question" button in the top right corner. The newly created question will be automatically linked to this question.

CCS 6.1.x - XDS200: Target configuration Test connection gives error: "E_RPCENV_IO_ERROR(-6) No connection: DTC_IO_Open::dtc_io"

Other Parts Discussed in Thread: AM3359, AM1802, CCSTUDIO, SYSBIOS

Team,

Could you please help with the below target connection problem?
Further info (SW version, firmware version, ..etc) will follow shortly.

XDS200 is interfaced via USB to a custom AM3359 board.
Emulation worked without problems good for 3 days but now it is always giving the following error in blue (rebooting the PC does not change the behavior).

  OS : Win 7 professional, 64 bit.
  User is administrator on the machine so CCS was not installed using "Run as Administrator"

The test connection log is:

[Start: Texas Instruments XDS2xx USB Debug Probe]
Execute the command:
%ccs_base%/common/uscif/dbgjtag -f %boarddatafile% -rv -o -S integrity
[Result]

 -----[Print the board config pathname(s)]------------------------------------
C:\Users\Alon\AppData\Local\TEXASI~1\CCS\
    ti\0\0\BrdDat\testBoard.dat
-----[Print the reset-command software log-file]-----------------------------
This utility has selected a 560/2xx-class product.
This utility will load the program 'xds2xxu.out'.
E_RPCENV_IO_ERROR(-6) No connection: DTC_IO_Open::dtc_io
Failed to open i/o connection (xds2xxu:0)
An error occurred while soft opening the controller.
-----[An error has occurred and this utility has aborted]--------------------
This error is generated by TI's USCIF driver or utilities.
The value is '-250' (0xffffff06).
The title is 'SC_ERR_ECOM_EMUNAME'.
The explanation is:
An attempt to access the debug probe via USCIF ECOM has failed.
[End: Texas Instruments XDS2xx USB Debug Probe]


Thanks in advance,

Anthony

  • Anthony,

    This error indicates an issue between the host PC and the JTAG debugger: check section 5.1 of the page below:
    processors.wiki.ti.com/.../Debugging_JTAG_Connectivity_Problems

    Therefore I would start looking at the items reported there, especially the ones that are the most elusive such as USB cables. Also, check the XDS200 troubleshooting issues as well (linked from the section above).

    Hope this helps,
    Rafael
  • Rafel HI,

    Thanks you for you answer.

    I already did as explained in section 5.1. There is the same problem, while running the ccxml file, I don't see the CortexA8 in the list. Test connection works only once, but only before I run the enter debug mode. The can't connect to target error message doesn't shown every time.

    Following all my environment details:

    Following the information I got:
    C:\ti\ccsv6\ccs_base\emulation\specdig\xds2xx>xds2xx_conf get xds2xxu 0
    boardRev=1
    ipAddress=0.0.0.0
    ipConfig=dhcp
    ipGateway=0.0.0.0
    ipNetmask=0.0.0.0
    productClass=XDS2XX
    productName=XDS200
    serialNum=00:0E:99:04:32:BE
    swRev=1.0.0.6
    hostCPU=AM1802
    emuCtrlType=Bit bang
    extMemType=SDRAM
    portUSB=true
    portENET=false
    portWIFI=false
    portRS232=false
    EnableUSBSerial=false
    CurrentMeasure=false
    What is the "hostCPU=AM1802"? I'm using the AM3359. Does it related to the ccxml file?
     

    2. I tried also to install the XDS Emulation Software Package page, but I don't see any change.
    I also note, that I followed the known issues of the XDS200, I update the XDS Emulation SW, in the explanation, it recommended to update to version 6.1.636.0, but the latest version is 6.0.83.1. After some installation issues it installed, but I don't know how to see its contribution.
     
    3. There is a single device on the JTAG, only the AM3359ZCZD72, the traces are pretty shorts, the JTAG connector is placed near the device.
    Since the interface worked properly for about 3 days (and more before the CCS re-install), I'm pretty sure that this is not an HW issue, it looks like a configuration mismatch.
     
    4. After PC rebooted, same error message. As I wrote in the past, there may not an error message, the CCS doesn't enter debug mode, or enter to debug mode, but I don't see the cores (again, maybe related to the configuration). 
     
    5. I'm using Windows 7 Professional, 64-bit.
     
    6. CCS version 6.1.1.00022
     
    7. Spectrum Digital Emulators 5.2.0.12 com.sd.ccstudio.emulation.win32.feature.group Texas Instruments.
     
    8. TI Emulators 6.0.14.5 com.ti.emulation.pack.win32.feature.group Texas Instruments.
     
    9. USB XDS200 emulator used.
     
    Does the problem may related to ccxml configuration?
     
    Thanks, Alon.
     
     
  • Alon,

    1. If you are able to display the information using <xds2xx_conf.exe>, then the OS device drivers are correctly installed. The AM1802 is the device inside the XDS200 JTAG debug probe and has no relationship with the target configuration file. One detail: the latest Spectrum Digital Emulators package (5.2.0.14, seen from menu Help --> Installation details) has a newer firmware version 1.0.0.8. Perhaps you could try that? It is located under ccs_v6/ccs_base/emulation/specdig/xds2x

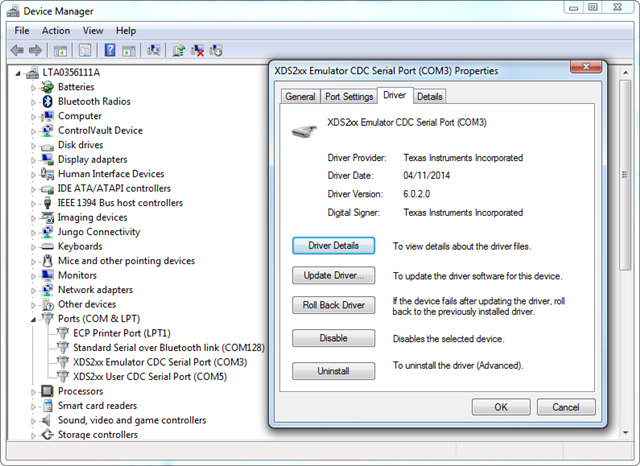
    2. How did you install the XDS Emulation software package? If you did from inside CCS then all should be ok. If you used the standalone installer, did you run as administrator and correctly selected the CCS install directory? I just want to be sure the OS drivers installed by the package and CCS are a match. If the latest versions are installed, they should show up as below:

    3. The error you are seeing from inside CCS is unrelated to the connection between the JTAG debugger and the device. However, since you mentioned the connection worked for three days, I have to ask: did you notice anything change in the software (any CCS or Windows updates applied) or hardware (the debugger heating up or its LEDs acting differently than what is shown in the XS200 page)?

    4. Would you mind sending the .ccxml file?

    All the other items seem fine by me.

    Hope this helps,

    Rafael

  • Rafael Hi,

    Following my updates.

    1. XDS200 FW updated to 1.0.0.8, no change in the behavior.

    2. All installed as administrator.

    3. I noticed that the CCS always run an updates. No Windows updated at this time.

    The debugger looks fine, no heating and Led on. After trying to connect (and while it looks stuck) the Led turn off.

    4. Following the copy of the CCXML file.

    <?xml version="1.0" encoding="UTF-8" standalone="no"?>
    <configurations XML_version="1.2" id="configurations_0">
    <configuration XML_version="1.2" id="configuration_0">
    <instance XML_version="1.2" desc="Texas Instruments XDS2xx USB Debug Probe" href="connections/TIXDS2XXUSB_Connection.xml" id="Texas Instruments XDS2xx USB Debug Probe" xml="TIXDS2XXUSB_Connection.xml" xmlpath="connections"/>
    <connection XML_version="1.2" id="Texas Instruments XDS2xx USB Debug Probe">
    <instance XML_version="1.2" href="drivers/tixds560icepick_d.xml" id="drivers" xml="tixds560icepick_d.xml" xmlpath="drivers"/>
    <instance XML_version="1.2" href="drivers/tixds560cs_dap.xml" id="drivers" xml="tixds560cs_dap.xml" xmlpath="drivers"/>
    <instance XML_version="1.2" href="drivers/tixds560cortexM.xml" id="drivers" xml="tixds560cortexM.xml" xmlpath="drivers"/>
    <instance XML_version="1.2" href="drivers/tixds560cs_child.xml" id="drivers" xml="tixds560cs_child.xml" xmlpath="drivers"/>
    <instance XML_version="1.2" href="drivers/tixds560cortexA.xml" id="drivers" xml="tixds560cortexA.xml" xmlpath="drivers"/>
    <instance XML_version="1.2" href="drivers/tixds560csstm.xml" id="drivers" xml="tixds560csstm.xml" xmlpath="drivers"/>
    <instance XML_version="1.2" href="drivers/tixds560etbcs.xml" id="drivers" xml="tixds560etbcs.xml" xmlpath="drivers"/>
    <instance XML_version="1.2" href="drivers/tixds560pru.xml" id="drivers" xml="tixds560pru.xml" xmlpath="drivers"/>
    <property Type="choicelist" Value="0" id="The JTAG TCLK Frequency (MHz)">
    <choice Name="Fixed with user specified faster value" value="SPECIFIC">
    <property Type="stringfield" Value="1.0MHz" id="-- Enter a value from 0.5MHz to 20.0MHz"/>
    </choice>
    </property>
    <platform XML_version="1.2" id="platform_0">
    <instance XML_version="1.2" desc="AM3359" href="devices/AM3359.xml" id="AM3359" xml="AM3359.xml" xmlpath="devices"/>
    </platform>
    </connection>
    </configuration>
    </configurations>

    5. During the last days, I noticed to the following:

    a. The cores shown only after the first time the CCS opened.

    b. In the second time, I don't see the cores, but the I can terminate the debug.

    c. While the cores seen, it could be also while the target board is turn off. Maybe it loaded from the CCXML file?

    d. I can't connect to the AM3359 EVB also with the on board emulator. This is the main reason that I think that the problem is in the environment and not in the HW.

    e. With the XDS200, I can connect to the target board, also it reported disconnected. run the GEL script and download the out file. At this time, I can't add breakpoints and debug, and this is my bug problem. 

    f. To be able to do the previous section, I need to do a precise sequence, turn off the target board, disconnect the XDS200, connect the XDS200, turn on the target board, open the CCS.

    From all the above it looks more and more like a configuration issue. Please advise.

    Thanks, Alon. 

  • Alon,

    Alon Arklis94 said:
    4. Following the copy of the CCXML file.

    I was able to connect to my board using your .ccxml file, therefore no syntax issues are involved. One question, though: why are you using 1MHz for the TCLK speed? Is it something required by your board?

    Alon Arklis94 said:

    5. During the last days, I noticed to the following:

    a. The cores shown only after the first time the CCS opened.

    b. In the second time, I don't see the cores, but the I can terminate the debug.

    c. While the cores seen, it could be also while the target board is turn off. Maybe it loaded from the CCXML file?

    This description resembles some sort of bad cache information from previous Debug sessions. Can you check item 5 of section 5 of the page below?

    http://processors.wiki.ti.com/index.php/Troubleshooting_CCSv6

    Alon Arklis94 said:
    e. With the XDS200, I can connect to the target board, also it reported disconnected. run the GEL script and download the out file. At this time, I can't add breakpoints and debug, and this is my bug problem. 

    Now you are able to connect using the XDS200 but the debug session seems strange? I suspect two issues: either the slower JTAG TCLK is severely impacting the debug performance (thus seeming frozen) or you are using a makefile project (not a CCS project) and is running into the bugs reported at this thread.

    In this case, could you reset the TCK settings and retry debugging with a different project? Better yet, can you retry with a different workspace altogether? The reason is that the workspace may sometimes influence the normal debugger, thus it may be worth trying.

    Despite it seems you were able to advance a bit on your debugging attempts, I am really grasping at straws at the moment (I am running out of ideas).

    Hope this helps,

    Rafael

  • Rafael Hi,

    Thank you for the reply, here are my updates.

    1. The 1 MHz clock configuration was only a try, we thought that maybe there is a problem with the clock. Basically it configured to 10 MHz. I check it with 1/10 Mhz, in both case it doesn't work.

    2. I clean the cache file, it didn't help.

    3. While I lunch the configuration file which I sent you, I get the 4 cores, but while connected, the CortexA8 didn't moved to suspend state, although the target is connected. Following the window, the connect button pressed, and the core reported as disconnected.

    Did the core in your connection moved to suspend?

    4. As far as I know, I using the CCS project and not makefile. How can I verify it?

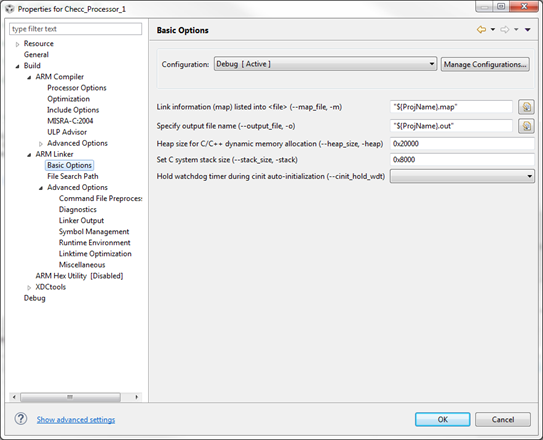
    This is the build configuration:

    5. I created a new project, it looks like all is configured fine, but I got the following message while program start running:

     [CortxA8] ti.sysbios.heaps.HeapMem: line 307: out of memory: handle=0x800aed34, size=8192

    xdc.runtime.Error.raise: terminating execution

    Although the linker basic options are as follow: 

    And the linker plot contains the right parameters:

    'Invoking: ARM Linker'

    "C:/ti/ccsv6/tools/compiler/ti-cgt-arm_5.2.5/bin/armcl" -mv7A8 --code_state=32 --float_support=VFPv3 --abi=eabi -me -g --define=am335x --define=idk_AM335x --define=sys_bios_ind_sdk --define=RMII_EN --define=RMII_CLK --define=DEBUG_CONSOLE_PRINT --define=am3359 --diag_warning=225 --display_error_number --diag_wrap=on -z -m"Checc_Processor_1.map" --heap_size=0x20000 --stack_size=0x8000 -i"C:/ti/ccsv6/tools/compiler/ti-cgt-arm_5.2.5/lib" -i"C:/ti/ccsv6/tools/compiler/ti-cgt-arm_5.2.5/include" --reread_libs --define=A8_CORE=1 --warn_sections --diag_wrap=on --display_error_number --xml_link_info="Checc_Processor_1_linkInfo.xml" --rom_model -o "Checc_Processor_1.out" "./common.obj" "./echod.obj" "./main.obj" "./osdrv_mcspi.obj" "./osdrv_spiflash.obj" "./plat_cpsw.obj" "./plat_i2c.obj" "./plat_mcspi.obj" "./sys_arch.obj" "./testcreator.obj" "./usb_host_mouse.obj" "./usblib/usbbuffer.obj" "./usblib/usbdata.obj" "./usblib/usbdesc.obj" "./usblib/usbkeyboardmap.obj" "./usblib/usbringbuf.obj" "./usblib/usbtick.obj" "./usblib/host/usbhhid.obj" "./usblib/host/usbhhidkeyboard.obj" "./usblib/host/usbhhidmouse.obj" "./usblib/host/usbhmsc.obj" "./usblib/host/usbhostenum.obj" "./usblib/host/usbhscsi.obj" "./usblib/device/usbdbulk.obj" "./usblib/device/usbdcdc.obj" "./usblib/device/usbdcdesc.obj" "./usblib/device/usbdcomp.obj" "./usblib/device/usbdconfig.obj" "./usblib/device/usbdenum.obj" "./usblib/device/usbdhandler.obj" "./usblib/device/usbdhid.obj" "./usblib/device/usbdhidmouse.obj" "./usblib/device/usbdmsc.obj" "./tests/ExSPI.obj" "./tests/eeprom.obj" "./tests/ethernet.obj" "./tests/flash.obj" "./tests/led.obj" "./tests/memory.obj" "./tests/mmc.obj" "./tests/peripherals.obj" "./tests/usb.obj" "./mmcsdlib/hs_mmcsdlib.obj" "./mmcsdlib/mmcsd_proto.obj" -l"configPkg/linker.cmd" -l"C:\ti\am335x_sysbios_ind_sdk_1.1.0.8\sdk/os_drivers/lib/sys_bios_driver.lib" -l"C:\ti\am335x_sysbios_ind_sdk_1.1.0.8\sdk/platform/am335x/lib/am335x_platform.lib" -l"C:\ti\am335x_sysbios_ind_sdk_1.1.0.8\sdk/starterware/binary/armv7a/cgt_ccs/am335x/evmAM335x/platform/platform.lib" -l"C:\ti\am335x_sysbios_ind_sdk_1.1.0.8\sdk/starterware/binary/armv7a/cgt_ccs/am335x/drivers/drivers.lib" -l"C:\ti\am335x_sysbios_ind_sdk_1.1.0.8\sdk/starterware\binary\armv7a\cgt_ccs\utils/utils.lib" -l"C:\ti\am335x_sysbios_ind_sdk_1.1.0.8\sdk/starterware/binary/armv7a/cgt_ccs/am335x/system_config/system.lib" -l"C:\ti\am335x_sysbios_ind_sdk_1.1.0.8\sdk\starterware\third_party\lwip-1.4.0\lib\lwip_static.lib" -l"libc.a" 


    while rebuilding the project, the linker.cmd has the following data:

    -heap  0

    -stack 0x2000

     6. Can you explain the connection process? while I'm see the cores it mean that the JTAG scan the devices successfully? while in my issue only the emulator part doesn't work?

    I would like to emphasize that I can download the out file but I cant see the disassemble which I may add a breakpoints.

    Please advise.

    7. It may be better if we could have a conference to solve this issue.

    Thanks, Alon.

  • Rafael Hi,

    Following the right capture for item 3.

    Thanks, Alon.

  • Alon,

    Alon Arklis94 said:
    3. While I lunch the configuration file which I sent you, I get the 4 cores, but while connected, the CortexA8 didn't moved to suspend state, although the target is connected. Following the window, the connect button pressed, and the core reported as disconnected.

    The screenshot looks standard to me - the XDS200 was properly recognized by CCS and the AM3359 device has all its four cores disconnected. When you click on the "connect" button, depending on the settings you may have to wait a bit until a GEL script finishes initializing hardware. During the process you should see some messages on the Console view. If you don't see that, it is possible the device is being resetting continuously, is incorrectly or insufficiently powered or the JTAG lines are noisy enough to degrade communications.

    Another detail: while I was testing a few combinations of the AM335x, I reached a scenario where CCS took forever to connect to my XDS200 + BeagleBone board. In this particular case I found out that my USB cable was very flaky - it connected quickly and fine when the cable was twisted around itself, but when extended the connection had probably became loose or something was loose inside the cable.

    Alon Arklis94 said:
    4. As far as I know, I using the CCS project and not makefile. How can I verify it?

    Your next screenshot shows it is a CCS project (it shows the TI compiler tools' options)

    Alon Arklis94 said:

    5. I created a new project, it looks like all is configured fine, but I got the following message while program start running:

     [CortxA8] ti.sysbios.heaps.HeapMem: line 307: out of memory: handle=0x800aed34, size=8192

    xdc.runtime.Error.raise: terminating execution

    This is a runtime error coming from the SYSBIOS RTOS, thus indicating the code is being properly loaded and running just fine. Therefore I can tell that you have successfully connected to the core, loaded code but your application is running out of memory (the TI-RTOS forum experts can help you with this).

    Alon Arklis94 said:
     6. Can you explain the connection process? while I'm see the cores it mean that the JTAG scan the devices successfully? while in my issue only the emulator part doesn't work?

    The connection process is shown in section 2.1 of the wiki page below. The fact you are able to successfully connect and run your code (despite the errors above) will bring this discussion to a different level: debugging the application itself.

    http://processors.wiki.ti.com/index.php/Debug_Handbook_for_CCS

    Alon Arklis94 said:
    I would like to emphasize that I can download the out file but I cant see the disassemble which I may add a breakpoints.

    With this last statement I can confirm you got past the basic JTAG errors that you were having in our last interaction. In this case, can you open the Disassembly view (menu View --> Disassembly) and see if it is displayed successfully? If not, try to reset the CCS Debug perspective (menu Window --> Reset Perspective) and retry opening this view. If that does not work, you may need to use a different workspace (menu File --> Switch Workspace --> Other --> type the path to a new one).

    These details should help with breakpoints as well. In case you are not seeing them, check if the Breakpoints view (menu view --> Breakpoints) contains any previously set breakpoints.

    Hope this helps,

    Rafael

  • Rafael Hi,

    Following the winning sentence:

    If that does not work, you may need to use a different workspace (menu File --> Switch Workspace --> Other --> type the path to a new one).

    After all we tried, the only thing that worked is to move the project to a different workspace. Once the project opened from the new workspace all the debug functionality returned. More than that, return back to the original work space is now working also.

    First of all, thanks for you support..

    Second, for the future, please advise what was the problem.

    Alon.

  • Alon,

    Thank you for sharing the outcome of the issues you were having. Usually running CCS on a new workspace tends to be one of the very early suggestions we give when problems during projects, screens or debugging are involved (something also mentioned in the Troubleshooting page).

    Unfortunately in my experience it is very difficult to accurately pinpoint a specific cause for the issues that either are rooted inside the workspace metadata or in the interaction between the workspace and Eclipse. Given that switching a workspace and re-importing the projects is a relatively painless experience, in practice this tends to be adopted.

    However, that does not rule out the scenario where you consistently get problems with workspaces or you have a broken workspace. In these cases we perform a deep investigation but usually require additional information from your system, including the workspace metadata itself and any faulty projects.

    I apologize for the inconvenience,

    Rafael

  • Alon,

    Sorry about not following up on your additional questions. The thread was marked as answered and therefore its activity was overlooked.

    Given your additional questions are very related to the application itself, I moved it to the Sitara forum and asked their team to look after the additional questions.
    e2e.ti.com/.../494950

    There is an outstanding bug that causes the debug session to become unstable when setting breakpoints, but that was observed in only when using pure makefile projects - not CCS projects like yours. In your particular case I suspect that some other instability is taking place - either on the board or on the JTAG itself.

    However, you mentioned using conditional breakpoints - I haven't tested that. How are you setting them?

    Regards,
    Rafael