This thread has been locked.

If you have a related question, please click the "Ask a related question" button in the top right corner. The newly created question will be automatically linked to this question.

CCS memory allocation view not showing data

Other Parts Discussed in Thread: CODECOMPOSER

Hello everybody,

I searched in the forum for any issues regarding the "Memory allocation" view in CodeComposer (I am using 6.1.1.00022) and I found several.
In my application I also do not see any data in the "Memory Allocation" view!
The map and XML file are generated both. The XML has a size of around 31MBytes.
To check if it works in general I tried a small application: there the view was as expected?

1. What can cause this issue (no memory view after rebuild)?
2. Are there any other Tools, which can evaluate (and Display) my map file or XML file in a nice way?

Thanks.

Best regards,
michaeL

  • Michael,

    Can you send me the xml file? I think I can just rename it to match my project name and see if a newer version of the tool will load it. Hopefully if you zip it up it will be small enough to be attached.

    Regards,
    John
  • Hi John,

    Sorry, that I only answer now. - I did not noticed that there was a reply. (Since I have activated the notifications, I checked my e-mail folder: yes, there was an e-mail, but only showing my question, not your actual answer.)
    However: thank you for the prompt reply.
    Due to legal reasons I can not send you the XML file which contains some confidential information (names of variables, functions).

    But the question is still of interest.
    Is this issue known? And if so, is it solved in a later version of CCS?

    Best regards,
    michaeL
  • Michael,

    I understand not being able to send the xml file. I did a search on bugs and I couldn't find anything that matches what you reported. I found one where it wasn't displaying but that was fixed in 6.1.1 (which you are using).

    The fact that it works for a small app and not your real app means there is something specific in the real app that is causing an issue.

    We have some scripts that can be used to process the memory allocation information. That package is available here
    processors.wiki.ti.com/.../Code_Generation_Tools_XML_Processing_Scripts

    It is not as pretty as looking at it in a graph but maybe it will meet your needs.

    If it helps at all we can use E2E to do a private conversation where your xml file would only be shared between you and I.

    Regards,
    John
  • John,

    Thank you very much for you reply.

    I managed it that the Memory Allocation gets displayed. It worked after I have changed  the option for the detailed link Information data base to "${ProjName}_linkInfo.xml" under Properties => Build => C2000 Linker => Advanced Options => Linker Output.

    I do not understand this behaviour, because I have another C2000 application where a custom name is used there. So, there seem to be certain dependencies.

    I also downloaded the Code Generation Tools. They seem to be very powerful. I will see what they can do for me, too.

    Regards,

    michaeL

  • Michael,

    Good to know.  I tried changing the name of the file in one of my projects and it still seems to read it ok.  I suspect that you are correct that the tool expects the file in a certain spot with something specific in the name.

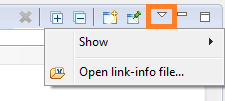
    One thing I found is that you can point the tool to a specific file.  If you go to the little down arrow it will give you the option to load a file.  This is mainly used to compare 2 sets of results but it could also be used when the tool can't automatically find the file.

    Regards,

    John