This thread has been locked.

If you have a related question, please click the "Ask a related question" button in the top right corner. The newly created question will be automatically linked to this question.

CCS/TMS320F28035: CCS Graph trace ADC on sine input

Part Number: TMS320F28035

Tool/software: Code Composer Studio

 I use a waveform generator to give a sine to ADC as below. Max value is 1.2V, min value is 0V, frequency is 1 Hz.

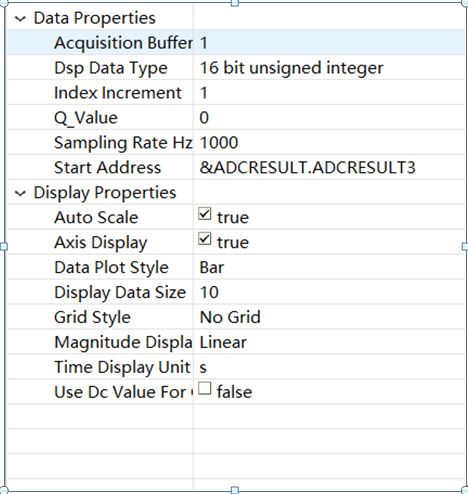
Configure CCS graph as below. Sample rate is 1000Hz.

In CCS graph, it is something as below. The shape is right, but the period is 0.012s. It should be 1s. 

The time between 2 graph sample Point is 0.001s, which is correct. 

Could you kinldy help me on this issue? 

  • I am very sorry, I post a wrong picture for CCS graph configuration. It is as above. Sample rate is 1000HZ. 

  • Hi,

    The issue you are seeing in your screenshots is a drawing error on the axis. This is reported in the bug report DVT-1935 (check its status in the link SDOWP in my signature below).

    Despite this has no effect on the waveform itself, unfortunately at this moment this is still an outstanding bug. Sorry.

    I apologize for the inconvenience,
    Rafael
  • Hello Dear Rafael:

    1. Thanks very much for your quick feedback. But i think it is not my problem. I configure the sample rate is 1KHZ. And you can see the time between 2 sample points is 0.001s, which is correct. But the period is 0.012s, which should be 1s. In DVT-1935, it says that

    '
    When creating a graph, setting the option "Sampling Rate Hz" does not seem to take effect on the displayed data - more specifically on the X axis.
    According to its documentation, this option should scale the X axis by dividing the "Display Data Size" per the "Sampling Rate Hz".

    2. And when i give a 16KHZ sine to ADC, I configure the sample rate as 1000000.But i have a really bad graph in CCS. If CCS graph can show a sine waveform of 16KHZ.
  • Hi,

    Please apologize for the delay. Are you still having this issue? A few comments about your last reply.

    1. You are correct that DVT-1935 is not really related to this issue. However, I think the graphs are correct. From your last picture I can count about 6 samples on the half cycle of the sinewave. Given each sample is represented as happening at every 0.001s, an entire cycle will be comprised of about 12 samples or 0.012s.

    2. When you increase the sinewave frequency on the ADC input, the CCS IDE can't update the graph fast enough to keep up with the reading rate of 1/16k samples, thus missing several samples and therefore representing a heavily distorted sinewave.

    In this case, you will forcefully need to create a buffer array that holds one or a few periods of the sinewave and then configure your graph to point to its starting address, set the Acquisition Buffer and Display Data Size to match your buffer size and set a breakpoint that updates the graph at the end of each filled buffer. Some details can be seen in the pages below:

    processors.wiki.ti.com/.../Graph_Visualization_for_MSP430

    Section 3.5 of:
    processors.wiki.ti.com/.../GSG:Debugging_projects_v5

    Hope this helps,
    Rafael
  • Hello Dear Rafael:

    It is very appreciated that you give me the detailed explanation as above. Now, i can understand that it takes some time for CCS to update the graph when buffer is full. So I use an Array with 1500 bits to show the waveform. But it seems that the waveform distorted around 1000 samples. 

    Give a 100 HZ sine to ADC-Vhb3. Use an array with 1500 to sample ADCRESULT5 register. Use CCS to show ADCRESULT5. When sample is around 1000, there is a bad waveform. 


    Do you know why? What is the max Array ?


    Thanks very much for your great help. 

    Rocky. 


  • Hi,

    I can't necessarily pinpoint the exact root cause for the glitch around the 1000th sample, as I don't know if this is present on the buffer or is a problem with the graph itself. If you haven't done so, you can validate this by opening a Memory Browser view, point to the array at a position near the 1000th sample and inspect if the data is correct.

    If the data in memory is correct, the graph may have a bug in its implementation. I recall an old bug that caused issues with this, but it was fixed a long time ago.

    I will do some more tests tomorrow and report back any findings.

    Regards,
    Rafael
  • Hi,

    Please apologize for the delay. I was not able to reproduce the issue on the graph.

    In the screenshot below I have a graph plotted with 2000 points that shows not glitches on the data displayed - I also tested with larger numbers of plotted points and found no evidence of problems.

    In this case I can tell there is no inherent problem with the graph functionality itself and the glitch may be located somewhere else in your system. 

    Regards,

    Rafael

  • Hello Dear Rafael:

    Thanks very much for your detailed Information. I suppose there are some Problems on my trigger of the acquisition. It is very appreciated for your Support on this issue, which gives me a huge help.