This thread has been locked.

If you have a related question, please click the "Ask a related question" button in the top right corner. The newly created question will be automatically linked to this question.

CCS/AM5728: Bypassing ETB for XDS 560v2

Part Number: AM5728

Tool/software: Code Composer Studio

Hello,

Is there a way to bypass the device ETB and store the trace information directly on the 128 MBytes System Trace buffer storage? The ETB is very small to store the entire trace for the program. So, I am thinking of ways to bypass it altogether or may be partially? May be we can halt the cpu, retrieve the ETB trace information on to the System trace buffer when the ETB is full and then continue to run the program again. Any suggestions if such a setup would work?

http://processors.wiki.ti.com/index.php/XDS560v2_System_Trace#System_Trace_.28STM.29

Thank you for your time.

  • Hi,

    If I understood correctly your post, are you trying to funnel the core trace information of the AM5728 device to the System Trace buffer inside a XDS560v2 STM Debug Probe? If so, that is not possible mainly due to the limitations in data throughput: if the A15 core is running at 1GHz, at least 2GB/s (thumb) or 4GB/s (ARM) is required to be offloaded via a minimal set of pins.

    However, there is a small software package (currently not supported but still available) that configures the ETB to offloads its contents to different destinations - this software package is called cToolsLib and is available at:
    processors.wiki.ti.com/.../CToolsLib

    Your device should be similar to the DRA7xx on the various examples of the different components.

    Hope this helps,
    Rafael
  • Thank you very much Rafael for the information.

    1) Do you know how much trace information I can gather using the 560V2 System Trace? Typically, I am noticing that I can get around 100000 records (+/- 10000).

    2) Are the records shown in the "Trace Viewer" before the ETB wrapped? Or it is showing the last 100000 records?

    3) http://dev.ti.com/tirex/#/?link=Development Tools%2FDebug Probes%2FXDS%2FDocuments%2FXDS Target Connection Guide

    [Sorry, about the link. It is malformed and I cannot link to it directly]. But, please refer to the XDS target connection guide.

    it says :
    "The advantage of exporting Core and System Trace data through the EMU pins to an XDS with trace capture support, such as the XDS560T or XDS560v2 System Trace product, is that the capture depth is much greater, providing a much larger region of visibility and enabling precise profiling and code coverage tooling."

    the AM5728 data sheet says that it supports system traces directly via de EMU bits (p. 372).

    so, the documentation seems to say that the XDS v2 trace is able to capture the trace through the EMU pins. I am not sure if it is done automatically or using the CToolsLib. Is the documentation there correct? It does not say anything about CToolsLib. Could you please comment on this.

    Thanks a lot for your valuable time and excellent support.

  • Hi,

    1) It is impossible to predict. The trace data is compressed and therefore highly dependent on the running code itself (a series of NOPs compress much better than control code)

    2) Save in a few exceptions, ETB is hardwired to operate in round-robin mode and therefore the Trace Viewer only shows the latest "n" records

    3) You are right; the AM572x family of devices contains the complete set of EMUn pins that allows exporting Trace data to external pins. However, the type of data you will get is highly dependent on the HW infrastructure you have: for System Trace you need either a XDS560v2 STM or a XDS ProTrace; for Core Trace you can exclusively use a XDS ProTrace.

    The previous suggestion to use cToolsLib was to address the Trace data capture based on your HW infrastructure.

    Although a bit outdated, the short clip below still contains good information about Trace:
    https://youtu.be/G3noymHTvGI

    Hope this helps,
    Rafael
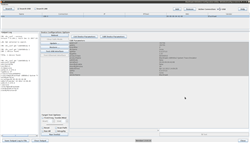
  • Thank you very much Rafael. The names of these emulators is so confusing for me. Indeed I have the USB560 v2 System Trace from BlackHawk (www.blackhawk-dsp.com/.../USB560v2-DS-01.pdf). Which is apparently not the same as BlackHawk XDS560 v2 (www.blackhawk-dsp.com/.../BH560v2-DS-05.pdf). Both look the same on first glance and even my USB560 v2 identifies its product class as XDS560 v2. See the screenshot below. These look like two different products. XDS560 v2 comes with the MIPI60 buffer board. Am I right?

    So, my question is, say if I buy the MIPI60 buffer board, can I use my USB560 v2 along with it to get the entire trace and bypass the ETB?

  • Hi,

    Yes, the USB560v2 does not come with the buffer board. However, this board does not provide Core Trace Capabilities. You need a XDS ProTrace to do that:
    www.ti.com/.../tmdsemuprotrace

    Cheers,
    Rafael