This thread has been locked.

If you have a related question, please click the "Ask a related question" button in the top right corner. The newly created question will be automatically linked to this question.

CCS/MSP430F2274: How to confirm that debugger can reach breakpoint in #pragma interrupt function?

Part Number: MSP430F2274

Tool/software: Code Composer Studio

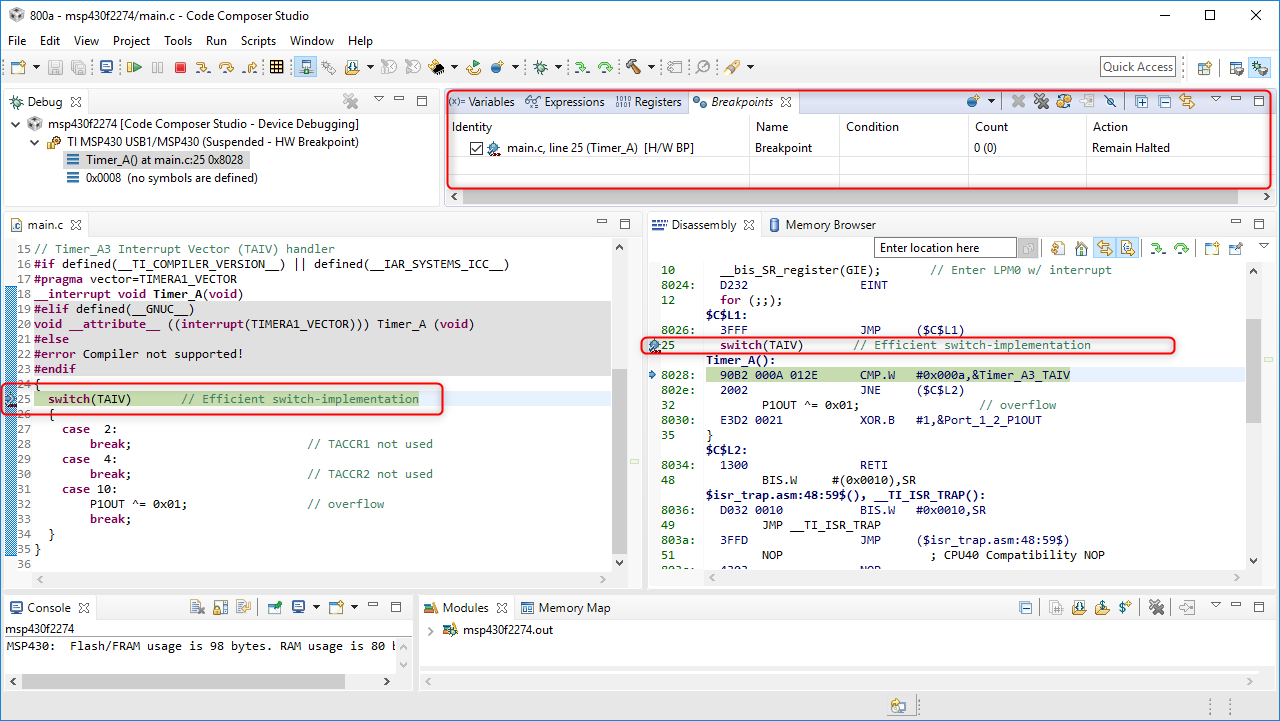
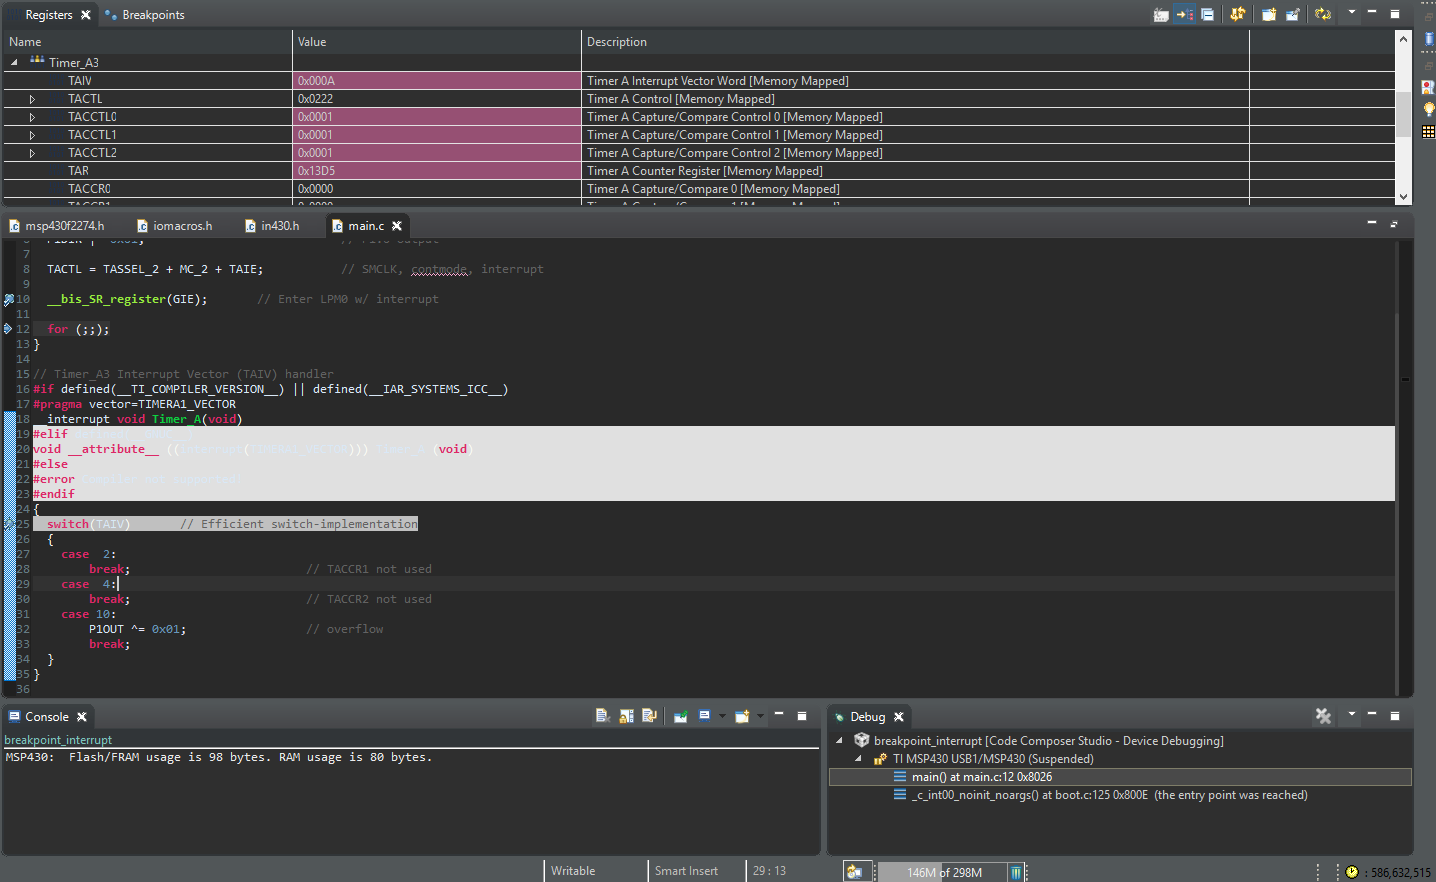
Have been trying to debug a simple example program for the MSP430F2274 device. The example uses timerA in continuous mode and toggles and LED when an interrupt occurs (a.k.a when TAIV = 10). Within the `interrupt void Timer_A(void)` function, I have set a breakpoint at a switch statement, which chooses the operation to be performed depending on the value of TAIV. When entering debug mode the program never stops at the breakpoint, making it appear that the interrupt is never reached. Upon viewing the register, I can confirm that an interrupt has occurred based upon the change in the TAIV register. Is it possible to have a breakpoint set in an interrupt function? If it is, could there be a reason as to why this it is never triggered during my debug session? If not, is there another method of debugging that confirms that the ISR is reached? Ideally, if the ISR can be stepped through it would be much more helpful for future project work using this device.

Furthermore, once the program is run from the debugger, the intended functionality is not happening until the device is disconnected and reconnected to a power source. The problem is that when disconnecting from the USB, the debugger stops working as it no longer has a device that it can reach for its debugging purposes. Is there a reason that this occurs, or is this common with all MSP430 devices? If not, are there any options which can be changed to allow the device to work correctly once the debugger has begun running, without having to disconnect/reconnect it? 

CODE:

#include <msp430.h>

int main(void)
{
  WDTCTL = WDTPW + WDTHOLD;                 // Stop WDT
  P1DIR |= 0x01;                            // P1.0 output

  TACTL = TASSEL_2 + MC_2 + TAIE;           // SMCLK, contmode, interrupt

  __bis_SR_register(GIE);       // Enter LPM0 w/ interrupt

  for (;;);
}

// Timer_A3 Interrupt Vector (TAIV) handler
#if defined(__TI_COMPILER_VERSION__) || defined(__IAR_SYSTEMS_ICC__)
#pragma vector=TIMERA1_VECTOR
__interrupt void Timer_A(void)
#elif defined(__GNUC__)
void __attribute__ ((interrupt(TIMERA1_VECTOR))) Timer_A (void)
#else
#error Compiler not supported!
#endif
{
  switch(TAIV)       // Efficient switch-implementation
  {
    case  2:
        break;                         // TACCR1 not used
    case  4:
        break;                         // TACCR2 not used
    case 10:
        P1OUT ^= 0x01;                 // overflow
        break;
  }
}

  • Hi Sean,

    Thank you for providing the test case. It is very helpful and appreciated.

    I set a breakpoint at line 25 and when I run the program, that breakpoint is definitely triggered. Can you provide a screenshot of your CCS IDE? I would like to see specifically the breakpoint set in the editor margin, the corresponding Disassembly view, and also the entire Breakpoints view. Something like the below:

    Thanks

    ki

  • Here is an image of my workspace in CCS. Again, the device will not run as predicted unless the device is disconnected and reconnnected to the USB. Based upon  the code provided, there should be multiple interrupts occurring each second, causing the LED to toggle rapidly. Once the program is run, there is nothing happening on the device until it is disconnected and reconnected, or after the debugger has stopped (by pressing the stop icon in the toolbar).

  • Sean Kramer said:
    Again, the device will not run as predicted unless the device is disconnected and reconnnected to the USB. Based upon  the code provided, there should be multiple interrupts occurring each second, causing the LED to toggle rapidly. Once the program is run, there is nothing happening on the device until it is disconnected and reconnected

    I just want to confirm that I am running the test case properly. When I load the program, I am at main. When I execute the program, I see the LED toggling rapidly. I assume that the code/device is running correctly. Then when I set a breakpoint at line 25, the debugger immediately halts there (as seen in my screenshot in my prior post). Does this sound right? I did not need to disconnect/reconnect to the USB.

  • btw - I am using an EZ430-RF2500T

    www.ti.com/.../ez430-rf2500t
  • Yes, that is correct, I too am using the EX430-RF2500T connection. As you wrote earlier, the code is supposed to work as you described. The issue with mine is that the device does not function correctly unless it is either disconnected and then reconnected or the debugger is stopped. The breakpoint at line 25 is also never hit, and the clock which works the timer does not run nearly as fast as it should (for example, it takes over 1 minute to reach the TAR value of 0xFFFF).

    Does the MSP430 Application UART need to be updated from the device manager window (running Windows 10 by the way)? The reason I ask is that on a different problem where the MSP430F2274 device can't communicate with the UART, I read on another site that the device driver needed to be updated. This probably is not necessary, but wanted to ask just to make sure.
  •  Here is an image that was taken from CCS, notice that it took almost 600 million clock cycles to reach this point, and that although the TAIV register has the value of '0xA' in it, the jump has skipped over the ISR, the LED did not toggle, and the breakpoint was not reached.

  • Sean - Do have the same issue (of not reaching the breakpoint) if the profile clock is NOT enabled?
  • I also get various USB enumeration issues with the EZ430-RF2500T. I had it connected to a USB hub. Now I connected directly to my machine and it seems to behave better, though I haven't tested it that long yet
  • Thank you for that suggestion, as it fixed my problem. Do you know why having the profile clock enabled would cause the debugger to not function properly, or why I can't single step through code when in low-power mode and the profile clock is enabled, but can single step while in low-power mode with the profile clock disabled?
  • The MSP430 has a limited number of emulation resources for hardware breakpoints. I believe there are only 2 available. Hence if you have 2 HW breakpoints already set, you cannot set any more. You also cannot single step, since single stepping requires setting a HW breakpoint. In addition to single stepping, there are other debugger actions that will use up a HW breakpoint resource. One is the profile clock. Another is standard C I/O. if you have the debugger set to halt at the exit point, that will use up another breakpoint, etc.

    ki
  • Sean Kramer said:
    Do you know why having the profile clock enabled would cause the debugger to not function properly, or why I can't single step through code when in low-power mode and the profile clock is enabled, but can single step while in low-power mode with the profile clock disabled?

    The MSP430 device families contain an Embedded Emulation Module (EEM) of differing capabilities.

    The MSP430F2274.xml device file specifies the emm of type "EMEX_LOW". From looking at the MSP430 debug stack source code in slac460y an emm of type EMEX_LOW (aka EmSmall in the source code) doesn't have a hardware cycle counter.

    I think when you try and enable the profile clock on a MSP430 device, such as a MSP430F2274, which doesn't have a hardware cycle counter the debugger has to step the program one instruction at a time to measure the profile clock. That slows down execution of the program significantly, and may cause issues when the code is in low-power mode.