This thread has been locked.

If you have a related question, please click the "Ask a related question" button in the top right corner. The newly created question will be automatically linked to this question.

Interpreting Nyquist diagram in TINA

I am simulating my communications receiver, a bandpass filter implemented using a cascade of 2 Multiple Feedback stages - a high pass filter followed by a low pass filter. So the circuit has 2 op-amps.

I am trying to analyze the stability of my overall filter by plotting the Nyquist diagram in TINA. I notice that it nicely plots the Nyquist plots of the various Outputs designated in my schematic i.e. the output of the first stage, and the output of the second stage.

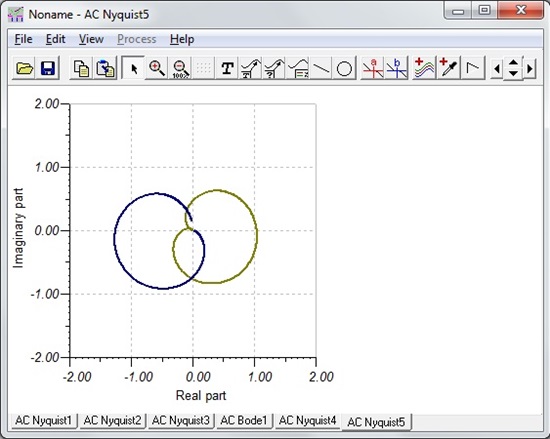
I am not sure how to interpret the results (picture pasted below). The blue curve is the Nyquist plot after the first stage, and the other is the plot after the 2nd stage. Since the first stage (blue curve) encircles (-1,0), does it mean the 1st stage is potentially unstable? Can I infer instability or stability directly from the plots?

I am also curious how TINA computes the Nyquist plot in general, and in this case, where there is feedback in stage 1 as well as stage 2.

Many thanks for any help!

Sira

  • Sira,

    Thank you for your detailed information concerning the use of the TINA tool in terms of simulating a bandpass file.

    Your Nyquist diagrams are very descriptive. I would say that your fist stage, which encircles (-1, 0) is unstable (according to the nyquist definition of stability). The second stage seems to be stable. I am curious about a few things with your circuit.

    1. How did you generate this 4th order bandpass filter? Did you use TI’s FilterPro and Filter designer, or did you use another method for generating this filter.
    2. Can you send me the circuit diagram through TINA? This would require that you attach the TSC file to your return reply.

    I am assuming that the TINA software performs the test book approach to determining this plots, but beyond that, I am not sure how TINA calculates the nyquist plots. I will research this further and give you an answer to this question as soon as I have more information.

  • Bonnie,

    Thank you for replying. 

    1. I believe FilterPro was used. We used 2 2nd order stages.

    2. It is attached.

    Please let me know if you are able to find out more about the Nyquist plot generation methods.

    Thanks,

    Sira

    5468.2ndOrderBPFv6MF - RevAE.TSC

  • Sira,

    I will get back to you when I hear from TINA. I have looked at your TINA solution and I get the same confusing results that you are describing.

    I do have some questions about your filter. What are the program values for your bandpass filter? Bassically what type of Bandpass filter are you designing. For instance, what are these values:

    • Gain (Ao)
    • Cneter frequency (f0)
    • Allowable Passband ripple (Rp)
    • Passband Bandwidth (BWp)
    • Stopband Attenuation (Asb)
    • Approximation type (Butterworth, Bessel, Chebychev, etc)

    Some other questions that I have are

    •  I can see have you have designed a MFB bandpass filter in the first stage. What is the purpose of the second, lowpass filter stage?
    • you have two input capacitors and a resistor. What is the pupose of this network?