This thread has been locked.

If you have a related question, please click the "Ask a related question" button in the top right corner. The newly created question will be automatically linked to this question.

TINA TI voltage source

Other Parts Discussed in Thread: BQ25504, TINA-TI

Hi. I want to simulate BQ25504 input power. My energy source can deliver have Voc=2.5V     Isc=1.5mA and in different conditions Voc=1.3V     Isc=0.45mA . How to do that input using TINA TI ?  I tried to do this using "controlled source wizard" , but without luck. I do not understand that function. Please if someone can upload .tsc file with that setup, thanks !

  • Hi Darius,

    Have you had a look at the BQ25504 TINA-TI Reference Design in the product folder? It has a solar cell model in there that uses a DC source in parallel with a TABLE Current Source. Can you use something similar for your needs?

    Thanks,
  • Darius,

    You can try out the block contained in this .TSC file.

    Current_limit.TSC

  • As I see, there is current source with a TABLE voltage source, or i'm wrong ? In the controlled source wizard there are marked output as "current" , so two parallel current sources? Let's say I need 1.5mA short circuit current, so i changed 400uA to 1.5mA (from bq25504 example project) , but i do not understand that table. What is input #1 and value -1 ? Or just simply...how should look table if i want 2.5V and 1.5mA output ?
  • Darius,

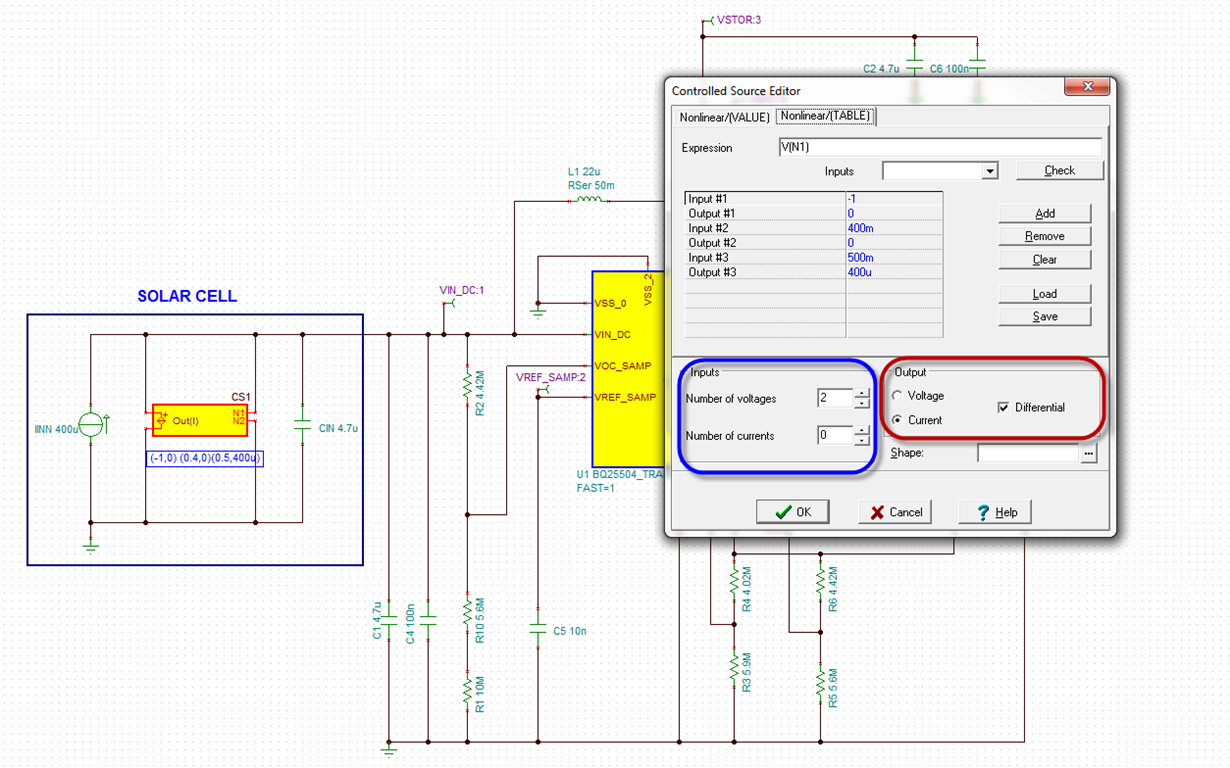
    If you double click on the table source, it provides more information about the inputs and outputs as shown below. Essentially, for all controlled sources (TABLE model is a controlled source), you can have a set of inputs (which can be voltages, currents or a combination) and an output (which can be either a voltage or a current but never both). In this case the input are pins N1, N2 and Output is a Current.

    Input#1 refers to the expression in the expression box on top. So in this case, if V(N1) = "Input 1" = -1V then the current output is "Output 1" = 0A. If V(N1) is "Input 2" = 400mV, then current output = "Output 2" = 0A. If V(N1) is "Input 3" = 500mV, then current output = "Output 3" = 400uA. If the voltage on N1 is in between any of the inputs then the output is based on the linear interpolation of the points surrounding that input.

    In this case you when V(N1) = 0 (mimicking the Short Circuit), you have a 400uA current flowing, using the DC source and no current being diverted by the table model, so current into BQ25504 is 400uA. As you approach the Open Circuit of around 0.5V all the DC current source is drawn by the TABLE model and none flows into the BQ25504. 

    I hope that answers your question.

  • Oh, i think i understand now. Please look at the picture and say or i did it correctly depending on source I-V curve that is on the right , thanks ![ Wrote wrong values in table. There should be input #2   1.25   ,  Output #2 0.825m and output #3 1.65m.

    Here is simulation results :

    Something wrong here. .

  • Your setup for the input look ok (with the corrected values you mentioned below the image). 

  • There is something wrong, o do not understand. If i leave solar cell input from example to my design, then everything looks normally (OV level, OK signal, MPPT) , but with different input everything is wrong. No MPPT, OV and OK levels are wrong.. Please look at my design, thanks!

    test.TSC

  • Hi Darius,

    Apologies for the late reply. In this device, some of the signal are not continuous inside the device bur rather sampled at regular intervals. In the device these intervals extend over several seconds, but it is not possible to simulate that with a switching regulator in spice. For the sake of simulation the interval has been drastically shortened. At the same time some of the capacitance have been reduced drastically to see reasonable waveforms in the time frame of a few minutes. As a results:

    1. The voltage on the nodes changes very fast compared to what you would actually see in hardware (due to reduced capacitance)

    2. Since the voltage is sampled, depending on where you cross the thresholds and where you sample, you may not see the exact threshold value on the waveforms in the spice simulation. Similar behavior will be seen in hardware also though may not be to the extent in the model as you will have much bigger caps/battery in hardware.

    This model is more to show the representative behavior of the device, but if you want to check actual timings, I would recommend that you do that in the hardware.

    Also the Battery management E2E forum will be a good place to post any device specific questions about BQ25504 in case you need further assistance.

    Thanks