Tool/software: TINA-TI or Spice Models
Hi,
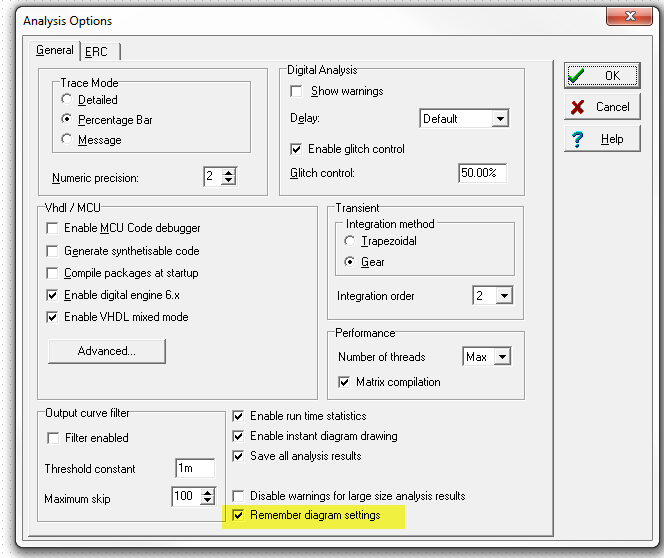
I'm running transient analysis in TINA that plots several output waveforms. The plots initially appear in one XY graph and using the View tab, I can choose to have the curves plotted separately. Clicking at the axis area in the plot and choosing properties, I can set axis properties like the number of ticks and upper/lower limit scale. I have to do these steps though every time I run transient analysis. Is there a way to save these settings so that I won't have to repeat these steps each time I run transient analysis?
Thanks for any tips regarding this.
Regards,
Joseph


