This thread has been locked.

If you have a related question, please click the "Ask a related question" button in the top right corner. The newly created question will be automatically linked to this question.

TINA/Spice/LMZ21700: AC model extrapolation

Part Number: LMZ21700
Other Parts Discussed in Thread: TINA-TI,

Tool/software: TINA-TI or Spice Models

I would need an AC model for the LMZ21700 in order to check the total impedance of the power delivery network in a digital system.

My concerns are the possible resonances between capacitors and the switcher output in the upper part of the bandwidth.

As an AC model is not available, I setup a simulation with the LMZ21700 transient model (set for 1.2V output) and:

- as output capacitor a 200 uF with 0.3 ohm ESR

- as load, the foreseen DC load (0.2A) and a strong AC component (0.2 A pkpk)

then I measured the resulting ripple at frequencies of 25, 50, 100, 200, 400 and 800 kHz.

I gained a fitting polynomial that gives a good approximation of the SMPS impedance: Z(w) = 0.018 - 2E-9 w + 1.8E-14 w^2   (w is the angular frquency 2*pi*f).

A voltage dependent current source in Spice with that frequency function  "G1 0 N001 N001 0 Laplace=-1/(0.018-2E-9*s+1.8E-14*s^2" seems to behave similar to the transient model.

Do you rate this method as reliable or can you advice some different way to go ?

Thanks in advance.

  • Hi Massimo,

    I am not aware of this method to measure the loop response. Do you have any literature you can point us to that describes this method in more detail. Also do you have access to SIMPLIS. I can check with the product team id we can open up some internal details to you that might make it easier to simulate the loop response.
  • Hi Nikhil,

    I can't give you any reference to papers, I've just applied a series of passages that in theory should work as they descend directly from the definitions.

    Where there is some doubt, is about using a polynomial that approximates the magnitude of the impedance but the phase is not taken into account.

    But, the subsequent verification of the time domain behaviour should assert the validity of the model.

    Can you give me the result I'm looking for (a model for the output impedance of a regulator made with LMZ21700, 7k5/15k resistive network to get 1.2V output and a 200uF/0.3Ohm cap) so that I can check if my method makes sense?

    Thanks again.

  • Hi Massimo,

    I checked and I am unable to provide the internal details of the device on this forum, but I will see if we can simulate the output impedance for you in SIMPLIS. It will take a few days to compile the results though. Thank you for your patience.

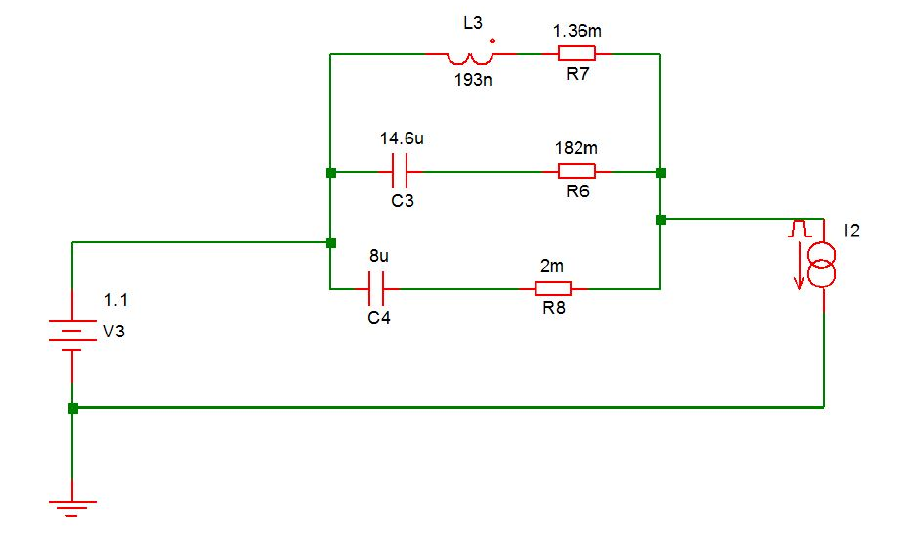
    Also the other way to approximate the output impedance is to used a lumped LC network (similar to below). You can simulate the load transient with this to get a rough estimate of overshoot and undershoot (and match to your transient model results). Once you are close, you can simulate the output impedance for this network. There should be an article from TI that will get published shortly on this. I will see if I can add the link to this post once it is made public.

  • Hi Massimo,

    We were able to setup the testbench in SIMPLIS to measure output impedance for LMZ21700. Test conditions: VIN=12V, VOUT=1.2V, ILOAD=3A CLOAD=200uF, ESR=0.3Ohms.

    Please find the simulation result below. I hope it helps.

    Thanks & Regards,

    Abhisek

  • Thank you Abhishek for dedicating time to my question.

    I refined my investigation (added some measurement points to low frequencies) so to better compare my results with yours.

    I found some encouraging matching apart from:

    - discrepancy at very low frequencies, likely cause of LTspice that defaults to 1 mOhm series resistance for any inductor

    - fixed 6 dBOhm offset at other frequencies (could it be that one model uses typical gain and the other one uses max or min?)

    Here's the plot of mine (red) and yours (green) result:

    What about the incoming article on that subject?

    (Or shall we write one together on my method? ;-)

  • The graph has not been attached... I'll try again:

  • Hi Massimo,

    We recently released an article about this topic:

    Abhishek's approach was based on this application note. Let me know if this helps.

  • Hi, and thanks once again for such fantastic support.

    I've read the article and I like that simulator. Unfortunately I don't know if my company will decide to buy such tool, as we're not facing the SMPS design issue very often.

    Anyway I will exploit the smart hints on how to generate a lumped model.

    As it seems that my approach with standard Spice simulation could give some reliable result, I would like to benefit from you kindness and try to deepen the mismatch causes.

    Some more observations came to me meanwhile, so I'm going to summarize:

    - The cause of the increased Zout at low frequencies are not clear: the 1mOhm default is excluded (but that is not very important to me as the range where the impedance is maximum and resonances with the capacitors is my concern).

    - The causes of the constant offset at high frequencies could be:

    1. Different input voltage: 5V for me, 12V for you

    2. Different output current: swinging from 0.1 to 0.3A for me, I guess 0.3A for you (on Abhisek's reply ILOAD=3A is mentioned but I guess it's a typo).

    Massimo

  • Sorry for correcting me once again. The low freq. discrepancy is likely due to default inductor series resistance.
    Tomorrow I will launch a simulation with such correction and with 12V supply.
    Thank you.
    M
  • Hello,

    I've still refined my method by using DFT to isolate the result from other noise.

    Furthermore, I had definitely proven that the default inductor resistance is not the cause of discrepancy.

    I ran another simulation with your transient model, where a load step from 0.3 A to 0.4 A is done and the output voltage drop is precisely measured by integration.

    The DC output resistance I evaluated that way is -69.7 dBOhm which seems to validate more my model than the amazing -90 dBOhm given by SIMPLIS.

    Following plot is the current status; measured points are at DC (here placed at 1 Hz) and then from 1 kHz on, compared with SIMPLIS output :

    I still think of some non ideality put by LTspice as default and not by SIMPLIS. Any comment from your side ?

    Lot of thanks.

    Massimo

  • Hi Massimo,

    Unfortunately, we do not provide support on LTSpice tool related queries. Hence, I won't be able to provide you any comparision. I regret for the inconvenience caused.
    However, please let me know if you have any other query specific to the model. I would be happy to help.

    Thanks & Regards,
    Abhisek
  • Hi Abhisek,

    thanks for the support so far.

    I've close the cased as my method in the end gave me a satisfactory model. It looks different from the one you found using SIMPLIS, especially at low frequencies.

    But it matches very well with the behaviour you can notice when a load step is applied to the transient model you deliver, as you can see below.

    If you want to get more details from me please let me know.