This thread has been locked.

If you have a related question, please click the "Ask a related question" button in the top right corner. The newly created question will be automatically linked to this question.

TINA/Spice/OPA548: OPA548

Part Number: OPA548
Other Parts Discussed in Thread: TINA-TI,

Tool/software: TINA-TI or Spice Models

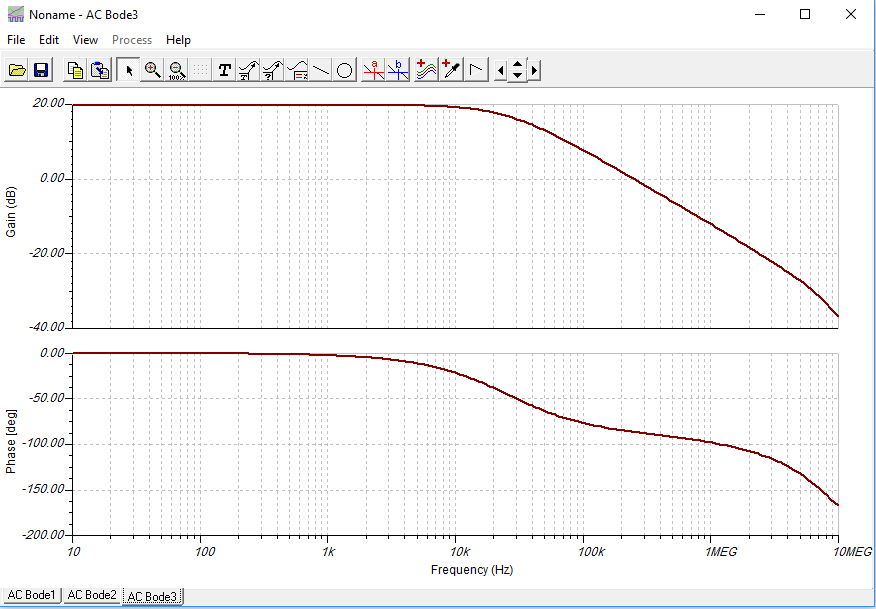
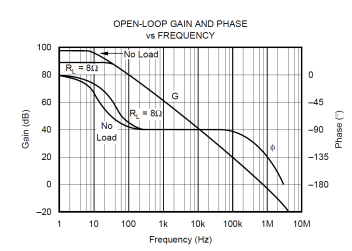
I am trying to derive a transfer function of OPA548 from its frequency response but the frequency response differs between the datasheet and AC analysis in TINA TI so which should i rely on ??!

  • Mekawy,

    The datasheet plot is the open-loop gain. In reality, when an amplifier is powered up without NFB, it will end up in saturation. That's probably the case with your simulation. You can run a DC operating point analysis to see if the output voltage is indeed close to one of the supply rails. If so, please add additional bias to the input to bring the output voltage to the common mode (0V since you are using split supply), then run the AC sweep again.

    Regards,
    JC
  • I ran DC operating point analysis and output was indeed near rail voltage. I understand what you are saying till the part where you mention adding additional bias to the input to bring the voltage to common mode, do you mean i should add a DC component to my AC source ? and what would that accomplish ? Thanks in advance.
  • In or close to saturation means your amplifier isn't going to give you much gain, as shown in your simulation. You can place a small DC voltage in series with your AC source and experiment with its value, until the output is around zero. This brings the device into the region where the gain is highest.
  • understood, thanks :)