This thread has been locked.

If you have a related question, please click the "Ask a related question" button in the top right corner. The newly created question will be automatically linked to this question.

Slight code change makes DSK6713 hang

Recently we observed some strange behaviour when creating a C program for DSK6713.

The C program itself is about 700 lines of code and is meant to generate music. From some point on in the development process it would not run anymore in the DSK6713 though compiler and linker did not report any errors. I tried a series of changes, always starting with a code that still worked and finally could boil it down to a situation where the line (case 1)
  argA = argB = argC = argD = 0.0;
somewhere within the code leads to a working version, while replacing this single line by the two lines (case 2)
  argA = 0.0;
  argB = argC = argD = 0.0;
at the same location in the code leads to a version that hangs. The same happens if I split the command into four separate lines, one for each of the variables. There should be no functional difference between these approaches, though the compiler will likely translate them differently.

The map file itself shows plenty of available memory. In case 2 it uses 0x20 bytes more than in case 1.

We use CCS5.5.0 as floating license with license information "full license" - I also tried it on a separate machine with the free license and also with a node-locked full license. All cases showed the same behavior.

Has anybody observed some similar behavior and found a reason for that?

  • Hi Rainer,

    Welcome to the TI E2E forum. I hope you will find many good answers here and in the TI.com documents and in the TI Wiki Pages (for processor issues). Be sure to search those for helpful information and to browse for the questions others may have asked on similar topics (e2e.ti.com).

    I tried with a simple hello world example to replica your issue, but it is working fine for me.
    Can you attach the code due to which it is hanging out.
  • Hi Arvind,

    thank you for taking a look into this issue.

    For sure I can send you the code. I am attaching the ok- and the nok-version:

    /cfs-file/__key/communityserver-discussions-components-files/791/2627.main_2D00_ok.c

    /cfs-file/__key/communityserver-discussions-components-files/791/8877.main_2D00_nok.c

    A simple code does not show the problem.
    For me it seems that there is kind of a max number of lines (though that sounds weird) above which the compiler/linker produces errors.
    Instead of using the 'main-nok.c' you could also uncomment line 640 in 'main-ok.c' (e.g. move the block comment begin one line further), and it immediately turns out to hang (at least that is what I encounter). Actually this was the place where we started running into trouble - it is part of the song definition, just a few more notes.

    To provide more information I also exported the CCS5 projects, zipped them and attach them at the end of the post - it is about 50k each.

    Best regards, Rainer

    /cfs-file/__key/communityserver-discussions-components-files/791/6560.StudProj_2D00_ok.zip

    /cfs-file/__key/communityserver-discussions-components-files/791/4885.StudProj_2D00_nok.zip

  • What is your compiler version (CGT) ?
    "Not ok" means, not able to hear music ?
    "ok" means, able to hear music ?
  • The compiler tools version is 7.4.4.
  • and: yes,
    '..ok' means the code works fine, I can hear the Music,
    and '..nok' means no music; if I press the 'Resume' button, the disassembly window immediately stops at the C$$EXIT label; if I single step, it works for quite a long time - I just tried it again to verify that.

    regards,
    Rainer
  • Rainer,


    Could you clarify your last statement, please?

    Are you saying that the 'nok' version will fail if you press the Resume button but it will work if you single step instead of pressing Resume?

    At what point are you in the program when you press Resume or single step? Are you at main() immediately after loading or somewhere else?

    How many times do you single step to get it to work?

    When it fails, do you get some sound out, even a click, or no sound at all? Can you set breakpoints in all the major tasks or functions just to see which ones are reached in the working case? This may have to be done one-at-a-time, or you may be able to set several at once and Resume from one to the next. The interesting thing to learn will be where the program does not reach when it fails.

    Please increase your stack and heap sizes to see if that improves the operation.

    Regards,
    RandyP

  • Randy,

    here is what I can say for the moment (I am not close to my development station today for any further tests):

    The 'nok' version fails as soon as I press 'Resume'.
    I haven't seen it fail while I single step (though I did several hundred single steps); each single step worked as expected. But as soon as I pressed 'Resume' from wherever I was after a set of single steps it would fail. Each time it failed I found it stopping at $$EXIT immediately.

    When I start single stepping I start at main() (this is how CCS is configured after loading the program).

    I can't remember whether there is a click while single stepping. However sound creation uses sine functions and starts with an argument of 0, so there is no big step from sample to sample and thus there might be no click even if it works fine.

    I have set breakpoints at several locations in the code and the program always stopped there when it reaches the breakpoint for the first time but often doesn't stop at / reach the breakpoint subsequently. I couldn't find a pattern yet of when it fails vs. returns to the breakpoint again.
    To further investigate any end-of-loop conditions/problems I have set the loop count variable of the inner loop (normally running for about 9000 times) manually close to the end (~8998) and single stepped until the end of the loop and through the outer loop until it entered the inner loop again, and this was also working as expected. I did this several times.

    Stack and heap sizes are default - I have a rather small number of local variables, the whole program sits in main() and contains only two calls of the write function to the audio codec in the loop; thus I believe that will not be a problem. However I can increase those sizes once I am back at my development station and see what happens.

    Regards,
    Rainer

  • Rainer,

    When it fails using Resume at main(), do you hear a click or any sound? I am wondering if it goes through the loop a few times.

    When it breaks at C$$EXIT, is the Call Stack valid? You will see the Call Stack in the Debug Window underneath the C6713 line. It will show all of the call locations that went through the current value of the stack. In fact, you can click on any of those lines to have the source code pulled up (if available such as within your application code) to show you the next line after the call - that means the line just before there is where the call occurred. If the Call Stack is corrupted, then the program execution did something very bad.

    Are you using a version of BIOS?

    To comment briefly on the cause of your problem, small code changes, yes this happens on most complex tool systems I have worked with including C++ on my PC. With the TI tools, the linker arranges the sections to be placed into a memory section by their size so that the space being used will be optimized or filled as well as possible. When a code section changes by 0x20 (the minimum it will change with the C6000 tools), that can push it to a different position in the output memory map. Normally, this movement of output sections does not affect the operation of the code, but in the case of errant pointers or stack/heap overflows, then some are of memory that really matters may get moved to a position that now gets corrupted, but before moving something else got corrupted and you never knew about the problem. You can compare the .map output file in your Debug or Release folder to see how the sections are arranged from a working build and a failing build.

    Regards,
    RandyP
  • Randy,

    I don't remember about any sound (though I wouldn't be surprised if there is none due to the sine-based sample sequence) nor about the call stack and will check it as soon as I am back at my developing system (this evening or tomorrow).

    BIOS: No I don't use a Bios; it's just a main() with an internal endless loop. Moreover there are no own functions and the only functions I call in the main loop are those from the BSL to send samples to the audio codec.

    Map/code sections: I did compare the map files of the ok- and nok-versions. The only difference is that the 'main.obj' section in '.text' is 0x20 larger.
    As that is the very first section, it moves all other sections as well as the entry point '_c_int00' further up in memory by 0x20. All other sections are the same size (Kdiff3 is pretty useful for that) and are put in memory in the same sequence.
    Used memory is 0x8a4c in the ok- and 0x8a6c in the nok-version, which is well below the available 0x30000.

    (by the way: if you like you can inspect the map files further if you suspect some strange memory occupation; they are contained in the zipped project-files which I attached at some former post.)

    Regards,
    Rainer
  • Randy,
    I just tried the nok-version again to answer some more of your questions.

    Call stack:
    When loading the program it shows the DSK6713 stack of 'main()' (with address 0x0) and 'cint_00()' (with address 0x5bf8):
    "Spectrum Digital DSK-EVM-eZdsp onboard USB Emulator/TMS320C671X (Suspended - SW Breakpoint)
    main() at main.c:31 0x00000000
    c_int00() at boot.c:87 0x00005BF8 (the entry point was reached) "
    After 'Resume' there is only an abort() on that list, which is the C$$EXIT location:
    "Spectrum Digital DSK-EVM-eZdsp onboard USB Emulator/TMS320C671X (Suspended - SW Breakpoint)
    abort() at exit.c:109 0x00005D80 (abort does not contain frame information) "

    Sound:
    There is a click when I load the program, another click after I press 'Resume' and finally one more click when I 'Terminate' the debug session.
    When single stepping from the begin of main() I hear a click at the "DSK6713_init()" function call, and a click at the "DSK6713_AIC23_openCodec()" function call. The "DSK6713_AIC23_write()" function calls only sometimes generate a click.

    Tomorrow I will potentially be able to try some more breakpoint variations to hopefully find some pattern in the system's behavior.

    Regards,
    Rainer
  • I now have perfomed some more tests:

    stack/heap size:
    I changed the stack and heap sizes from their default of 0x800 to 0x1000, and the nok-version still did not work, while the ok-version expectedly did fine.
    I also decreased the sizes of heap and stack to 0x600 to see whether the program is close to its limits, but even in this case the ok-Version worked well while the nok-version (expectedly) failed.

    breakpoints:
    I tried to find some pattern about the situation shortly before failure, looking into the nok-version:

    1. I set a breakpoint in the outer loop at line 677: it always was reached for the first time, never after a 'Resume' for a second time.

    2. I set an additional breakpoint in the inner loop at line 689: consecutive 'Resume' actions after 'Restart' stopped at line 677 and then subsequently at line 689. After about 20 such 'Resumes' with successful stops at line 689 and because I didn't want to step through all ~9000 cycles of the inner loop I set its loop counter k to 8898 (thereby shortcutting the inner loop) and continued with 'Resume' actions. The program stopped 3 times at line 689 and then (surprisingly!) again in the outer loop at line 677. Thus it had reached the outer loop breakpoint unexpectedly for a second time.
    I continued with that (setting k to 8898), and reached line 677 again for 2 or 3 times. After that the C$$EXIT showed up.

    3. I modified my loop counter k set value several times, and finally could find a pattern such that repeatedly after 36 loop cycles of the inner loop the program failed, ending at C$$EXIT. This happened no matter how often I did a shortcut in the inner Loop, even in the case of just 36 subsequent inner loop cycles without a shortcut action.

    4. I now 'Resume'ed after a 'Restart' until I reached loop cycle 35 and then single stepped (line by line C-based) until the C$$EXIT showed up; thereby I found it happened when processing line 689 (which is "x = x + ampA *sin(argA);").

    5. I then ran till line 689 after 36 inner loop cycles and changed from then on to 'Assembly Step Into'. This brought me right into the assembly code of the sin() function, which I actually don't understand. However after about 70 steps C$$EXIT was reached.

    6. Now: why did the sin() call work for the previous 36 loop cycles? For that to find out I played with the value of the sin-function argument. It soon turned out that higher values lead to a failure while lower values work; for me it seemed that pi/2 is the key value above which sin() did fail.

    7. Next I worked in 'Assembly Step Into' mode through the sin(x) function for a value x=1.4 (<pi/2) and x=1.6 (>pi/2) and found that the internal assembly processing took different paths for these two values, and the path for x=1.6 ended at C$$EXIT. I could confirm this for a few more values >pi/2.

    8. However the really interesting question (and the starting point of this post thread) was: Why does everything work fine with the ok-version and fail with the nok-version? There is no difference between the two versions in that part of the program where the sin() is called.
    Thus I loaded the ok-version to find the difference in its behavior. I also put an argument of 1.6 into the sin() call and did 'Assembly Step Into' subsequently. Except for the fact that the ok-version sits at an address 0x20 below the one of the nok-version the whole path through the assembly code was identical until at 0x5d48, shortly before the C$$EXIT location (which is at 0x5d60 for the ok-version), the ok-program branched back to some code location at 0x47ac while the nok-version just stepped over a series of NOPs right into C$$EXIT.

    9. I tried to further understand what was happening and compared ok- and nok-version behavior in that sin() function when its argument is >pi/2. As I said above I don't really understand how the function works. For me it seems that it itself calls a subfunction labelled '_trunc' which then calls a subfunction labelled 'modf'. In the ok-version the sequence sin() -> calls _trunc -> calls modf -> returns to _trunc -> returns to sin() seems fine. In the nok-version it seems to me that the return from _trunc to sin() does not work.

    10. One even deeper look seemed to reveal to me, that the register B3 is used for the return address to sin(). B3 is loaded from the stack, which could be observed in the ok-version, but which did not happen in the nok-version.
    Interesting in the nok-version is that the (wrong) content of B3 should make the program branch to that location, which does not occur (why??). Also, after a few of those NOPs before C$$EXIT B3 seems to be loaded with the correct return address, but the return action does not occur anymore.

    I am attaching a zip with three screenshots, each containing the register and disassembly window at the location where I would expect a return from _trunc to sin():
    a) screen-ok-rd01: it shows the PC and B3; the content of B3 (0x47ac) is the correct return location, and one assembly step further this is copied into the PC and the program correctly continues from there.
    b) screen-nok-rd01: it shows the PC and B3; the content of B3 (0x5d58) is not the correct return location, but the program also does not branch to 0x5d58 in the next step but continues with the following NOPs. Three NOPs later:
    c) screen-nok-rd02: it shows the PC and B3; the content of B3 (0x47cc) now is the correct return location, but the program does not branch there but just continue till C$$EXIT.

    This is where I have to give up.

    Is there anybody out there that can resume from here and find out why the same code behaves differently just by being moved 0x20 bytes further, and what I am supposed to do to make it work in this and future projects?

    Regards,
    Rainer
    /cfs-file/__key/communityserver-discussions-components-files/791/0728.screens.zip

  • To all: I will be gone for some time now and will not be able to answer any upcoming questions or perform further testing until 25-August.
    Regards, Rainer
  • First of all disclaimer. I don't have 6713 and can't verify any of the findings, as well as that below reasoning has speculative character.

    As for 10. Basically it looks as if processor executed block of zeros, which translates to series of simple nops. I mean the fact that branch was never taken and correct return value showing up in after a while looks as if multi-cycle nops and branch instructions simply were not there. Is it possible in principle? Well, you have to recognize that debugger peaks into memory, while processor picks instruction from cache. So that if for whatever reason cache line goes out of sync and is filled with zeros, you probably would observe in debugger exactly that. Also note that instruction past  LDW is actually on cache line boundary, and so is C$$EXIT, so that phenomena can be explained by that one cache line going out of sync. Once again, this is speculation and can be just wrong...

    I'd say that most important question at this point is if somebody else (at TI) can confirm this specific problem on another 6713 system. For this reason it would be appropriate to execute exactly same binary, so that I'd suggest to post the actual problem binary.

    BTW, note that you can relocate code at arbitrary base address by specifying alternative origin for IRAM. I mean currently you have o = 0x00000000  l = 0x00030000, but if you modify it as o = 0x00000010  l = 0x0002FFF0, the code will be moved by 0x10 bytes. This way you can see if there is any pattern in failure, that might turn to be helpful for understanding...

  • Thanks for the hints.
    Being back at my station, I did some tests with varying IRAM location/size:
    1. for the nok-Version:
    a) o=0x00000020, l=0x0002FFE0 --> same problem (proceeding to C$$EXIT)
    b) o=0x00000040, l=0x0002FFC0 --> same problem (proceeding to C$$EXIT)
    2. for the ok-Version:
    a) o=0x00000020, l=0x0002FFE0 --> now also becoming not ok, with same problem (proceeding to C$$EXIT)
    Thus it seems for the moment that the location of the sin-function code is crucial
    In the original ok-Version it starts at 0x46A0,
    In the original nok-Version and in 2.a) it starts at 0x46C0,
    in 1a) it starts at 0x46E0,
    in 1b) it starts at 0x4700.
    Looks like in the cases where the sin-function code starts at a location behind 0x46A0 and the argument of the sine is larger than pi/2 the program doesn't work correctly but proceeds to C$$EXIT.
    The sin-function is imported from the rts6700.lib, as provided by TI.

    "post the actual problem binary": This is contained in the CCS Project which I already posted as zip-file on Aug-04.

    Regards, Rainer
  • I for one wouldn't put all the blame specifically on location of the sin-function right away. I mean the fact that your application suffers when making call to sin can still be circumstantial. That was kind of the idea behind suggestion to "jiggle" whole binary, to see if you can provoke crash of some other kind. So "move" it by more than 0x20 bytes. What happens if you do by 1KB? Past its current end? At the "bottom" of IRAM? Of course if it fails in same way independent of position, then it ought to be something triggered by software. Otherwise one probably shouldn't discount probability of hardware fault...

    Once again I want to remind that I have no 6713 to confirm, nor in position to make anybody verify the failure on another processor.

  • I had some time to perform a few more tests with relocating the code.
    As a result I found that though in many cases the problem appears to be in the sin() function, there are also several more locations that do not work as expected, depending on where I put the IRAM start. Among them were as simple cases as e.g. a sequence of
    to[0][32].freq=440;
    to[1][32].freq=349.228231;
    to[2][32].freq=261.625565;
    to[3][32].freq=87.307058;
    where the program counter never reached the line "to[2][32]...." but kept looping within a set of ASM commands around "to[1][32]...". That case occured with IRAM starting at 0x5000. Really strange.

    When moving the start of IRAM up, I did not encounter any problem up to now with IRAM starting at 0x6840 or above, but saw problems when IRAM starts at 0x6820 or below. However I do not have an explanation for that.
    I also tried to put the program (length ~0x9e00) close to the end of IRAM (i=0x26000, o=0xA000), and did not observe a problem.
    Thus a trivial workaround for the moment is to set i=0x8000 and hope that no problems show up any more. At least it may work as long as the software fits in the remaining space, though it would really be helpful to understand the cause of the problems.

    I would appreciate very much if someone else with a DSK6713 could load the two projects I posted on 04-Aug in this thread and
    (1) could report on the observations. If the ok-version works and the nok-version does not work that is then at least a hint that I don't have a hardware failure. Though I have observed the problems in at least 3 different DSK6713 Systems here, there might still be a case where they are from the same defective production charge.
    and/or (2) could provide some ideas about the reason for that behavior,
    or (3) even has experienced similar situations before and knows about a reasonable explanation for them.

    Best regards, Rainer
  • sorry, typing Errors: not "(i=0x26000, o=0xA000)" but "(o=0x26000, l=0xA000)" and not " i=0x8000" but " o=0x8000"
  • Oh! I wrongly assumed that you have access to just one system. I'd say that probability of "bad batch" is low enough to assume it being architectural problem as more like. As you're talking to a peripheral I'd first try to remove that from equation. I mean just comment away calls DSK6713_AIC23_write to see if it calculational part crashes or not.

    BTW, note that you can also "make holes" in memory if it turns out that you have to avoid certain addresses for reasons that can't be formulated now. By specifying multiple disjoint regions in .cmd file and instructing linker to use multiple regions, e.g.:

    IRAM0 o=0, l=0x800

    IRAM1 o=0x1000, l=0x800

    ...

    .text >> IRAM0|IRAM1|...

    ...

    I don't feel I can contribute more on the matter...

  • Rainer,

    With the project build that you describe above with the to[4][32] array of structs, you have something that should be 'easily' debugged. I put easily in quotes because it means using the CCS debugger and stepping through assembly code in the Disassembler Window. Since these are fairly simple C code lines, this process will be workable.

    First, get back to that code build and save it after verifying that it still fails the same way. If it does not fail the same way, then my instructions for debug could need a lot of revision.

    Assuming you are able to build the code with the 'to' arrays of structs as shown above and it fails in exactly the same place, please go through these steps:

    1. Since the to[0][32] line is the last one that works correctly, set a breakpoint there and run to it.
    2. Open the Disassembler Window and make sure you are at the location of the PC. It should show the matching C code there, too, for reference.
    3. Open the registers window and go to the Core registers display, and open the Expressions window and put in the four to[n][32].freq names so you can watch there values.
    4. Use the Assembly Single-step Over icon to step slowly through that to[0][32].freq=440; line, watching how the registers and contents of the .freq field are updated.
    5. When you get to the to[1][32].freq C code line, make a note of the exact addresses for the assembly instructions, especially noting which one is the last one that seems to be right, matching the code for the to[0][32].freq line.
    6. Capture a screen shot that shows your C source, the Disassembly Window showing the assembly for the to[0] and to[1] lines, plus the Expressions window and the Core Registers showing all of the Ann and Bnn registers. Capture that just before and just after the failure.

    Steps 5 & 6 are more generalized than you will need, but I wanted to put them in in case you end up branching into some part of code you should not be in (commonly the cause of a crash).


    In your case, since you said the PC "kept looping within a set of ASM commands around "to[1][32]...", then the most likely problem is some errant pointer or stack problem is causing your program memory to get corrupted. Immediately after loading your program, go look at the code in the Disassembler Window to see if it has the right code or take a screen shot to post here. Then run to the breakpoint and take screen shot to see if it was always corrupted or is now corrupted.

    If it was always corrupted then you have a memory or cache or loading problem. If it was okay and is now corrupted after running to the breakpoint, you will need to do a binary search to see how far you get before the code gets corrupted. Then you can start narrowing it down and find out exactly when that happens.

    Good luck. I will try to watch for replies this weekend, but no guarantees.

    Regards,
    RandyP

  • Randy,

    thanks for the hints - here is what came out of some further tests:

    a) First and important I could re-establish the erroneous behavior of yesterday with IRAM o=0x5000 l=0x20000 at the code location "to[0][32]...". I made a screenshot of the code part immediately after loading, when the PC is at "main", and also one after having proceeded to that code loation where the DSP is looping. Both are in the attached zip, named "screen-nok-03_after_loading.jpg", "screen-nok-03_when_looping.jpg". The Disassembler window shows the same code in both cases. Thus no code overwriting is obvious.

    b) When I start single-stepping (Assembly Step Into) there is the already mentioned interesting loop sequence over the addresses ... 0x5F5E-0x5F60-0x5F64-0x5F68-0x5F6C-0x5F70-0x5F74-0x5F78-0x5F60-0x5F64-... (you can have an idea of it from the DisAss view in the screenshot, where it shows the PC at 0x5F60 and the previously executed commands with shaded background) repeating this loop all over again. Even if I do "Resume" and then "Suspend" after some time, it is still in that loop.
    Interesting to note that also the "to[0][32].freq=440;" assignment did not complete, as the value of that variable is remaining at 0.0, which is its initialization value.

    c) Now, though I don't know the Assembler, I tried to figure out what that code snippet should do. For me it looks like a series of register and memory assignments, but I can't see a branch command among them. And nevertheless the PC branches from 0x5F78 to 0x5F60. Seems like the DSP processes a completely different code than is displayed in the DisAssy view.

    d) Another really astonishing observation was that the Axx and Bxx registers do not contain what I would expect (e.g. shouldn't B4 show zeros in it?) and none of them changed value when stepping through the loop. Even when I manually changed e.g. A3 to a different value, that set value remains there when continuing the stepping through the loop.

    That is the state for now. Looking back I originally started with a situation that the program unexpectedly ended at C$$EXIT, where it seemed that a required branch did not occur, and now I have a different IRAM Setup, where a branch occurs that should not be there....

    To All: I hope this is not specific for our site. I can't remember having any problems at time of installation, and also observed the initial problem on a node-locked license system as well as on a floating license one (with different people having set up those systems). However I would appreciate if somebody with a DSK6713 could at least reproduce the initial problem (the one given by the nok-version CCS project posted here some time ago) to make sure we don't have a singular case at our site.

    Regards, Rainerscreens02.zip

  • As an addendum I have recorded the commands right before the looping starts; they are attached in screens03zip.

    From them one could note:

    1) everything seems ok before the PC reaches 0x5F40

    2) I assume 0x5F40 should set zeros in the upper bits of B4, 0x5F44 should change A3 and 0x5F48 should change B5; all that did not happen.

    3) also: shouldn't 0x5F40, 0x5F44 , and 0x5F48 run in parallel and thus process in one step? The DisAssy needed three single steps.

    4) 0x5F50 should change A3 but it did change A7.

    5) 0x5F58 needed two(!) steps and instead of changing B4 it did change A0.

    screens03.zip

  • Rainer,

    These screenshots are great!

    Because the execution does not match what we see in the Disassembly window, the implication to me is that there is a cache coherency problem. This would mean that the Disassembly view is seeing something that is not in the Program Cache, which is not what I would hope for.

    I am not sure what cache viewing is supported with the C6713, but one thing to try is to look at the 0x00005f00 (really just 5f40) area to see what the memory browser shows. For some devices, you will have click boxes to select whether you are viewing what is in the caches or what is in physical memory. If this is available and it shows a difference, that will point us in one direction; if no difference, another direction. If not available, we will have to come up with something else to try.

    If there is an issue with cache coherency, then turning off the program cache would be a good debug tool. But, I am not sure how easy that is to do with the C6713, if it is possible. If your BIOS configuration has cache settings, then it could be possible to do it globally there, or there might be CSL or BIOS commands; sorry I do not know those off the top of my head.

    Another debug test to try is to load your program, then go immediately to the to[3][31.freq line. In either the C source view or the Disassembly window, you should be able to right click on that line and choose Move To Line to force the program counter to there. This is not a valid thing to do in most cases because the program stack will be wrong, but none of these lines use the stack or anything other than the values they get in the code. The one exception is 0x5f48 that expects a value to already be in B6, so you will have to ignore what gets written to to[3][31].freq, assuming it happens right - just the fact that something gets moved correctly and something gets written will be a big clue.

    Cache corruption is very time sensitive, since the cache can be re-fetched any time and the problem goes away. We have added a lot of tools in the silicon for newer processors to allow visibility into problems like this.

    The most common cache coherency problem is caused by DMA transfers since they don't trigger a cache update. But I would have expected that to show up in the Disassembly view.

    Does this code get executed a lot? That could mean that it stays in the cache and does not get re-fetched very often. This is hard to predict without studying the entire project flow.

    How big is your entire .text section? This would be in the linker .cmd file. If it is less than the size of the Program Cache, then the whole program would fit in cache and not get re-fetched ever unless manually flushed.

    And another thing to try is to manually flush the program cache. Putting in code to do that would move your failing code around, so the best option would be to figure out how to do that manually by writing directly to the cache registers using the debugger. How to do that would be in the source for a CSL program cache flush routine or in the Two-Level Memory User Guide.

    [Update: To manually flush the L1P cache, write 0x0000020x to CCFG, where the x value is the current value in the lowest 3 bits that set the size of L2 cache (what value is there, for my information?). CCFG is at the memory-mapped address 0x01840000, and can probably be found in the Registers Window, or in the Expressions Window you can put "/*CCFG*/ *0x01840000" (no quotes, hopefully my syntax is right) and then you can click in the value field and write a value there.]

    [What peripherals does this application use on the DSK? Does it use external RAM, or McBSP, or just does processing?]

    With some of the results from the questions and test above, we can figure out which additional tests need to be done.

    Regards,
    RandyP

  • Randy,
    following your hints I found:
    1. Cache viewing: I could find and open the CCS5 cache view but it did not let me enter any location and also remained empty. Finally I found in the CCS help "Cache visibility is only supported on TMS320C64X+ devices." So we won't get any information about that.
    2. Memory browser: I compared the memory content from the memory browser with that in the disassembly view in the area 0x5F20..0x5FA0. All values were identical.
    3. BIOS: I am using no BIOS on the C6713 - just a plain main() with infinite while() in there.
    4. Disable cache: I am not sure about that, but the processor spec mentions a CCFG Register which seems to be located at 0x01840000. This shows all 0s which according to the processor spec means that L2 cache is disabled. L1 cache seems to be on all the time.
    5. Move to the "to[3][31].freq=.." line: I did that immediately after program load, but the wrong looping 0x5F78-0x5F60 still happens. Also the registers that should be assigned some values (like A3, B4, ...) don't show these values; instead, some other registers change values while stepping from 0x5F34 to 0x5F78. Further on, during Looping, no register changes value (as was already noticed before).
    6. Code get executed a lot: No, this code-part is one-time executed initialization; the endless while() is further down. The original problem (the one I started the thread with) was within an infinite loop, thus executed all over again - but that is not in the focus at the moment.
    7. code size: The size of .text according to the map-file is 0x5D60, I think this is bigger as the L1 cache on the 6713.
    8. flushing the cache: I didn't find a way to do that looking at the CSL sources (they are not easy to understand). Instead I tried to invalidate L1 cache by setting bit 9 in CCFG at 0x01840000, but whatever I typed in there was not accepted - this is somehow also what the processor spec says: read-only access. I then found the PCC field in the CPU CSR, which was set to 000. I tried to play with that field (i.e. load program to DSK, when at main() change the register value, run to "to[3][31].freq=..", then Assembly Step Into), but in all cases the program looped as before.

    So far for today,
    regards, Rainer
  • Rainer,

    If you power cycle the board and try this again, does it fail the first time?

    What peripherals does this application use on the DSK? Does it use external RAM, or McBSP, or just does processing?

    #8 Flushing the cache: bits 8 & 9 of CCFG are Write-only so you will never see a value of 1 there even if you write it into bit 9. But the effect should be that the L1P cache gets fully invalidated. After writing to it, did you try the code to see how it fails still? I would try it both running to the assignments and stepping over them, and also loading then moving to there and stepping over them.

    Sometime this will kill things if you are using a lot of peripherals that get configured during C initialization or in the GEL script, but after loading the code, do a GEL_Reset. There may be a pull-down icon on the Debug Window that includes 2-3 resets. If doing any or all of those does not kill your code load, then you could move to the assignments and see how they do.

    If you would, please zip up the whole project that you are using now - this would be easier to debug than the original one. I do not know if there is anyone able to try it out, but at least it could be available to try.

    Regards,
    RandyP
  • Randy,

    thanks for looking that deep into this issue.

    Peripherals: I use the McBSP to access the audio codec, no external RAM, no LEDs or switches.

    The project is basically still the original nok-Projekt; just IRAM moved to o=0x5000 i=0x20000, and a few changes in comments.
    Anyway I have exported it from eclipse and zipped it. Please find it attached to this post.
    If somebody wants to try it, I believe that only two directory paths need to be adjusted for compiler and linker in the build settings.

    I need to stop for today and will get back to what you proposed to test in post above next week.

    Regards, Rainer

    StudProj-nok2.zip

  • Randy,

    I managed to squeeze in some more tests with following results:

    a) PowerCycle: I tried this a few times and could not observe a different behavior with vs. without intermediate power-off; in both cases the program got stuck in that loop.

    b) CCFG Bits: you are right. When manually setting bit 9 in CCFG to "1" it seems that nothing changed (it reads back as "0"). But when I then go to the questionable code section it displays a completely different content! I have made two screenshots, both showing the code section as well as the memory browser content immediately after loading the program (without stepping through it):
    1. "screen-nok-L1P.JPG": code section and memory browser with CCFG untouched
    2. "screen-nok-L1Pinv.JPG": code section and memory browser with CCFG bit 9 manually set to "1"immediately after loading the program.
    The memory range displayed in the memory browser shows differences between those two cases in the areas 0x5F28-0x5FDF, 0x6000-0x601F, and 0x6100-0x613F. There are probably more differences outside the range that is presented.

    Just for inspection purposes I did create a TI-TXT flash image and looked into it. Around the questionable code section it showed a HEX code that was identical to 1. Looks like the Compiler and linker did their job as expected.

    Does this help in further locating the cause of the strange behavior? I don't have a clue what could have caused the memory content to change.
    Regards, Rainer

    screens04.zip

  • Rainer,

    Yes, this definitely helps. This shows that there is a difference between what is in the L1P cache and what is in the L2 IRAM locations at the point in time of the PC being at the start of main(). And that you have a way of detecting that difference, even though it is manual, by invalidating the L1P cache.

    You have shown that there is a difference between what was loaded by CCS before running and what is now in L1P. This scenario does not make sense to me, but that does not matter much. Just finding the problem is what matters, then the logic of how it happened may become more clear after that.

    Something is writing the corrupting values to L2 memory. Those values appear to be related in groups with somewhat incrementing values, but a quick look through your code does not find anything that might have done that. It will take a longer look, by doing some debug through your code to find it.

    My CCS installation is CCSv6, so your version may vary slightly. If you right-click on your project in the Projects window and select Properties, then in the left-hand pane of the box that comes up you can select Debug from the bottom of the list. There is an Auto Run and Launch line in the selection pane of the Debug box, click on it. Uncheck the box under Auto Run Options that says "On a program load or restart", and also "On a reset" if it is checked (not common). Now when you load your program it will stay at _c_int00 after the load occurs.

    Now, load your program, note that it does stop at _c_int00 instead of running to main(), and go check your program code at 0x5f10. Write 0x20n to the CCFG register to see if it changes. At this point, there should be no difference between the two. If there is a difference, now that you have done the L1P invalidate, try reloading and repeat the comparison.

    Assuming no difference, you will need to debug through the assembly code to find when the corruption occurs. The quickest way to debug it will be to do assembly debug in the disassembler window, otherwise you will need to extract the source code from the runtime support library files to use source code. There is likely a call (B instruction?) to _auto_init and the corruption will likely be in there; this is where all global variables get initialized if initial values are specified.

    You can just step for a long time watching what happens, or run to a breakpoint and check if the corruption has occurred, or whatever method works for you. Eventually, you will narrow it down to something that is writing to this area incorrectly.

    Regards,
    RandyP
  • Randy,

    in some further investigations I tried what you suggested, making the program stop at "c_int00". I again include a few screenshots.

    1. Without any assembly step I investigated the memory and found it looked ok ("screen-nok-cint-L1P.jpg").

    2. I then set the cache invalidate bits and without any assembly step I found the memory already corrupted ("screen-nok-cint-L1Pinv.jpg")

    3. I repeated this several times, thereby also includíng a few power cycles , but always found the same situation: memory already corrupted when arriving at "c_int00".

    4. There happened to be slight differences between the memory content around 0x6128 after subsequent load actions (see e.g. "screen-nok-cint-L1Pinv2.jpg") , though I could not find a pattern about when it changed vs. when it was kept the same; anyway the memory content was not what it should be. Also contrary to the last post, the corruption started 8 bytes earlier, so that the code seemed to be changed from 0x5F20 and not starting from 0x5F28 as seen the last time.

    5. Starting from "c_int00" I stepped all through the assembly right to "main" (with the help of a breakpoint to jump over a series of memcpy calls), but did not see any further modifications to the memory area I was observing.

    6. Finally another observation: to invalidate the cache, I had set both invalidate bits in the CCFG Register (0x01840000) up to now, to be sure to not miss the right one. I played a bit with these two invalidate bits and got the impression that setting IP does not reveal the corruption but setting ID does it. At least according to the ProcessorSpec I expected IP at bit 9 and ID at bit 8 (on a 0-based bit numbering). However if I set the CCFG Register to "..0 0010 0000 0000" the code corruption is not visible, if I set it to "..0 0001 0000 0000" the changes to the code can be seen. With the latter I invalidate the data Cache L1D. Is this of importance?

    Regards, Rainer

    screens05.zip

  • Rainer,

    The disassembly view might be (I am not certain) fetched through the L1P interface to L2 and therefore affected only by the L1P invalidate command. The memory browser view will be fetched through the L1D interface to L2 and so it will be affected by the L1D invalidate and not by the L1P invalidate. Of course, I could be wrong on this and both might come from a separate memory bus for emulation, but I think what I said is true. Maybe just keep in mind that they might be different and that we might not be seeing what we expect to see.

    If something is stored and waiting to be written out from L1D and then you do an invalidate, that new data will be lost and not written. A safe thing to do, and a good test to try, is to invalidate both and then to load your program.

    I would get rid of your GEL file just to make sure it is not doing anything. Are there any times that you see messages to the console indicating things are happening after you connect to the process or do anything else like loading the program or hitting reset? To remove the GEL file, after launching the Target Configuration and before connecting to the target with CCS (do not use the 'bug' icon but do all the steps separately), in the Debug Perspective select the target in the Debug window without connecting, then go to the menu line Tools->GEL Files. You can then select the GEL file, right-click and remove it. This will affect initialization of peripherals and PLL and other things possibly, so we can hope that everything works otherwise.

    Which boot mode do you have selected with the BootMode pins? What are the values for the rest of the Configuration Pins?

    Another tool to use for this debugging is the memory save/load feature of the Memory Browser. You can take a section of memory, like 0x5f00 and save 0x100 words to an ASCII file. Then you can also load that same section of memory from that file. This would be another way to compare the expected contents with the real contents and maybe a way to put the contents to the right values for debug purposes.

    The fact that there was corruption immediately after doing the load without running at all tells me that something was running and something was happening to put values into L2 that are not supposed to be there. My current thought is that the processor is running something it should not be running while the load operation is going on. In fact, it may be that a GEL_reset() should be done before every program load, but even that could be leading to a problem if the DSP starts running from Flash or somewhere else, so it is important that the bootmode pins be set to 00 for Emulation mode, make sure the processor is halted, hit CCFG with 0x300, and then load your program.

    We have to be getting close, so these few tests may help.

    Regards,
    RandyP
  • Randy,

    I am not quite sure that I understood completely what you suggested.

    Here is what I tried:

    1. Console showing further activity: No, the console does not tell about any further actions.

    When not changing the code it ends with "gmake: Nothing to be done for `all'.  **** Build Finished ****"

    When introducing e.g. a blank character and storing it, it builds the out files anew and thereby prints a lot of stuff, also ending with "**** Build Finished ****".

    In both cases after that the console does not add any further messages.

    2. L1P vs. L1D: I tested to invalidate L1D, L1P, and both to compare the outcome. In all 3 tests I reloaded the program before I set the invalidate bits. Other than yesterday I looked not only at the memory browser but also at the disassembly window in the questionable memory area due to your hints. Results:

    - invalidating L1P alone did not change memory nor disAssy window.

    - invalidating only L1D showed the same result as invalidating both. The result is really interesting: the content of memory browser and disassembly window are different from each other! I attach the screenshots "screen-nok-5f18-L1Pinv.jpg" (only invalidating L1P) and "screen-nok-5f18-L1PDinv.jpg" (invalidating both).

    - Also strange to me: now the disAssy window does not set the ass.commands to 32bit-boundaries in this memory area (though it still does around c_int00). I thus scrolled through both views to find the start of this boundary corruption, which I found is around 0x5DA0 (see screenshot "screen-nok-5da0-L1PDinv.jpg"). As a sidenote: obviously there were code corruptions even before 0x5F18, but they seemed not to harm a lot, at least did not lead to looping around and thus went unnoticed.

    3. GEL-file: I tried to follow your guide but could not find how to launch a target configuration without the "Bug" button.

    I also did not see a "Tools->GEL Files" menu entry. I finally found GEL files in the Control Panel view, but there it said I should start a debug session and select a target, which I don't know how to do. When I start with the "Bug" button and then look at the GEL files in the Control Panel view, that list is empty, thus probably indicating there are none?

    4. Boot mode: all pins of SW3 are in the off position (as is recommended).

    5. Memory copy: I am not pretty sure what you wanted me to do. What I did is:

    Loading the program ("Bug") such that it waits at c_int00. Then copying the memory area 0x5000..0x5FFF to a file. Then invalidating L1P and L1D, which caused the memory to appear corrupted. Then loading memory 0x5000..0x5FFF from file. Then starting ("Resume"). This made the program work fine.

    I hope this helps.

    Regards, Rainer

    P.S.: I will be gone for a business trip from tomorrow - might be able to still do some tests in the next few hours today (if you want me to), and then hopefully resume next week.

    screens06.zip

  • Rainer,

    Since you are going to leave soon, I will look at the screenshots later.

    3. After freshly opening CCS, if you left-click on the down arrow by the bug icon, it will show 1 or more Target Configurations, with the latest at the top of the list. You can click on that item in the list and it will launch the Target Configuration only. Second, you can go to the newly opened Debug Window and right-click on the lowest DSP or C6713 line and select Connect Target. Third, you can find the Load program icon on the top icon ribbon and click it to select a previously opened file or re-load the latest or Load from browsing. Those three steps are done automatically by the bug icon, and you would normally not need to repeat the first two when you are running tests and changing your program code. Whenever you change the code and build it again, you should be prompted that it has changed and you can select to have it automatically reloaded.

    When doing this, after doing the Connect Target step, it should indicate where the PC is and the DSP should be started. At this point, do an invalidate, and then load your program to see if things will work.

    It is possible that the problem is that you do not have a GEL file and it is needed. There should be a default one for the DSK6713 that came with CCS, so you can do a search on your computer for dsk6713*.gel to see if it is there. We can discuss using a GEL file later depending on how this all works out.

    Regards,
    RandyP

  • Randy,

    a quick reply on the target configuration:

    I don't see any such target configurations when clicking the down button at "Bug", jaus as given in the screenshot attached.

    I will search for DSK6713 GEL files next and let you know.

    Regards, Rainer

  • Randy,
    and - yes, there is a GEL file named "DSP6713.gel", but it says inside that it is for use with CCS3.x.
    I am currently working with CCS5.
    Regards, Rainer
  • Rainer,

    When you clicked the down-arrow by the bug, it shows 4 Target Configurations, the first one is named StudProj. If you click on that one, it will be launched, and then you can do the Target Connect. Most of the time when I am debugging a program, I launch once, Target Connect once, and load my program many times without having to do those first two steps again. This would make things run faster since you would not have to wait for the launch and connect.

    I assume there is a typo in the file name, and it is DSK6713.gel. If so, then we can be confident it is designed to work with the DSK board and will setup the EMIF and PLL and everything you need to be done.

    After launching your Target Configuration, you can click on the C6713 line in the Debug window to select it (before Connecting) and find that GEL files menu the way I mentioned above or however you found it earlier. In the GEL files box, you can right-click and request to Load GEL, browsing to the file you found above. Now, when you Connect there will be an OnTargetConnect() function in the GEL file that runs automatically, and before it loads your program it will run OnPreFileLoaded().

    You can look through these functions to see what they do. There is likely a GEL_reset() and/or flush_cache() function call in OnPreFileLoaded().

    This will have a good chance of solving your problem.

    Regards,
    RandyP
  • Randy,

    I took some time to do some more tests today, looking into the issue of the GEL files.
    1. yes, it was a typo; the GEL file is "DSK6713.gel", and there is one in the DSK6713 distribution and one in the CCS5 distribution (with a difference in the reset_pll() function).
    2. when I click the down-arrow by the bug and select the "StudProj" target configuration it will connect automatically. Anyway I tried to play with several sequences of "disconnect - connect - reload program - resume" without a GEL file, and it always went to the looping case and got stuck there. This is as it was before.
    3. I then did a sequence of "disconnect - load GEL file - connect - reload program - resume" and it seemed to work fine. I did this several times with both versions of the above GEL files and did not observe any problems any more nor differences in the behavior between the two Versions of the GEL file.
    4. Finally I found that it seems to be sufficient to click the "bug" button, then load the GEL file, reload the program and click the resume button.
    5. Also I noticed that the GEL file disappears when stopping the debug process; it needs to be re-loaded each time, which is a bit tedious.

    Actually I don't really understand what is happening in the DSK between pressing the "bug" button and starting the program by "Resume" from the debugger window, and what finally is the difference when the GEL file is involved. But maybe I don't want to go deeper into that as long as it works, as I suppose that will take quite some time.
    I wonder whether the GEL file can be automatically loaded. That would help a lot in working with the debugger, and I would assume it must be possible (and one of your past posts also seemed to imply that), but I didn't find a way to add a GEL file to the configuration settings (I looked at File->properties and StudProj->Show Build Settings).

    Regards, Rainer

  • Rainer,

    It looks like the problem with program memory corruption has been solved by using the DSK6713.gel script. It would have been best if the documentation that came with the DSK6713 had mentioned this should be used, or if the DSK6713 installation process had included a Target Configuration with the correct GEL file already attached.

    My recommendation is to post your questions about using CCS and the GEL files on the E2E Code Composer forum so the experts there can address your questions more accurately and more fully. I know there are a lot of settings that can be made, and the way I normally run emulation is different from the experience you are having now. If you can open the Target Configuration to edit it, on the Advanced tab is where you specify a GEL initialization script. But getting there and all the options available there are better answered on the CCS forum.

    Good job getting to a working system.

    Regards,
    RandyP
  • Randy,

    thanks a lot for the time you spent to guide me through this issue.
    At least a workaround is found. I played a bit with moving the code around and also extend its size, and with the GEL file I did not encounter any problems anymore up to now.

    I will take a look into the CCS threads to find out how GEL files can be included right from the start. That would help to avoid a manual GEL file load followed by a program load each time a debug session is started, which is really cumbersome after some time. Hopefully using the GEL file will not have any drawbacks (at least I didn't encounter any).

    You also made a point in recommending that the need for the GEL file should be mentioned (in bold letters !) in the DSK documentation or even better it should automatically be included (if possible) in any CCS-projects using the DSK6713. I still don't know what was the cause of the problem; was it code size, or size of the two-dimensional array of structs, or... But I would assume if the DSK6713 is not just used for pretty small applications, also others should stumble across this problem.

    Thanks again,
    Rainer

  • Rainer,

    The use of the GEL file is not a work-around, but is a requirement when using emulation for debug on the C6713. The work-around would be to do the same steps that the GEL does before each Load Program step.

    Not using the GEL file can lead to this same problem with any size of program. The cache has to be in a known state for proper operation, and the emulation mode can lead to problems prior to Program Load.

    Most people use the Target Configurations and GEL files, so I did not recognize the problem.

    Regards,
    RandyP
  • Randy,

    thanks again for the hint regarding the missing GEL file.
    As the manual loading of the GEL file each time after starting a new debug run is laborious, I looked through the TI documentation on how to load the GEL file automatically. There is not much written about that, but after some hints in your posts and in other threads and own trying I finally found a solution (and looking back, it's not that difficult).
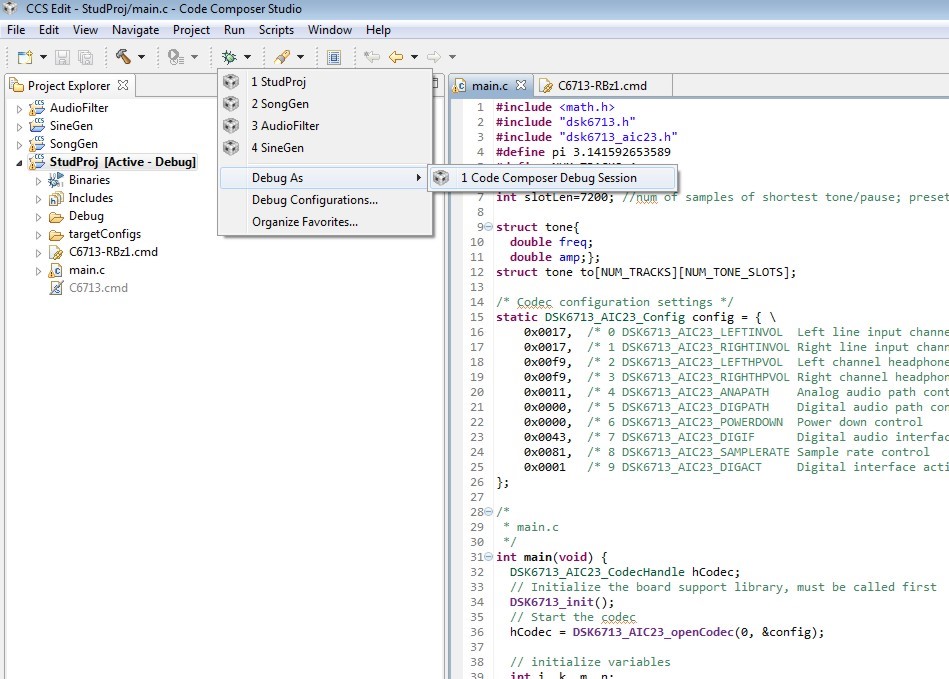
    Now the GEL file is part of the CCS project and is automatically loaded when pressing the 'Bug' button.

    From my point of view, the issue is solved and this thread can be closed.
    Should/could I do that or is it something the TI staff does?


    For all who have followed the thread up to this point and themselves wonder how to add a GEL file to a project, here is how I managed to do that in CCSv5.5:
    1. In the "Project Explorer" view: double-click on the project. A folder icon "targetConfigs" should be seen in the project.
    2. Double-click on "targetConfigs". An entry "*.ccxml" should be in there (with * being some config name).
    3. Double-click on that entry. It should open a new tab in the editor view. This tab has three inner tabs "Basic", "Advanced", and "Source", which appear at the lower left edge of the editor view.
    4. Select the "Advanced" tab. It shows on the left side ("All Connections") a tree, where the leaf is a CPU (in my case it is "TMS320C671X").
    5. Select the CPU. This causes "Cpu properties " to appear on the right side, where some settings can be made, among them "initialization script".
    6. If there is no GEL file yet specified, the text field to the right of "initialization script" is empty, otherwise it contains the path to the specified GEL file.
    7. To change the GEL file or to specify a GEL file: either type in the path of it or use the "Browse" button next to the text field to navigate to it.
    8. Do a "File-->Save" to save the settings - done.

    Actually the *.ccxml is a xml-type text file in a sub-directory of the project that one could also edit manually. However I could not find much information on the xml syntax and how to modify it; thus using the GUI of CCSv5 and going through these 8 steps is definitely better and is probably the recommended method.

    Regards,
    Rainer