This thread has been locked.

If you have a related question, please click the "Ask a related question" button in the top right corner. The newly created question will be automatically linked to this question.

Interruption Delay on LCDKC6748

Other Parts Discussed in Thread: MATHLIB

Hello,

I would like to start by thanking TI for all the documentation and examples it provides for its customers. We also found the forum very helpful most of the times.

We are developing our project on a TMS32C6748 for a realtime application. We run into a problem with interrupt latency which we cannot find an apparent reason/solution.
Let me first, describe in brief the design and  implementation of the system :
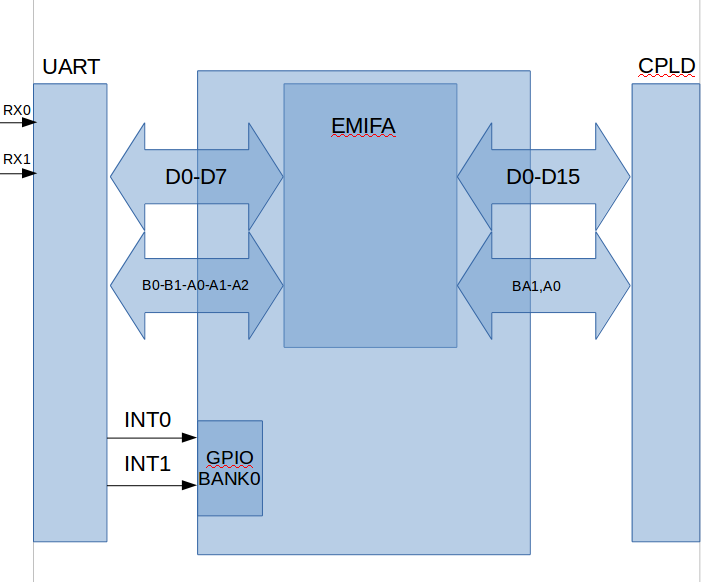
The DSP is connected to a 5 MegaBaud Dual Channel Uart  (  64 bytes FIFO, programmable trigger levels, multiple status/config registers )

Via Emifa ( 48Mhz speed, CS4 memory space, Asynchronous, 8 bits mode, and timings according to the datasheet of the uart chip)

and also, 2 interrupt lines connected to GPIO Bank 0 (1 and 2 ).

Functional design :
Each millisecond, the DSP receives a total of 192 bytes per channel, divided into 3 packets of 64 bytes (the fifo maximum capacity), which takes 180 microseconds, spaced by 100 microseconds ( to give time to the CPU to service the interrupt)
For the sake of simplicity, lets call the received bytes from both channels a 'data sample'.
The DSP is supposed to run an algorithm on 2080 samples which uses among other things, DSPlib, MathLib.

Implementation :
In order to maximize CPU usage, Servicing the interrupt is done by an ISR to check the Status registers, which will later trigger manual EDMA3 event to buffer the incoming data into a ping pong fashionned way and feed it to the algorithm which is supposed to run in the main program.
We are running the board at 456Mhz through Code Composer 7, an XDS100v3 and C6748 Starterware 1.2.4 . The code is linked to run from DDR2 with L2 Caching Enabled.
Result :
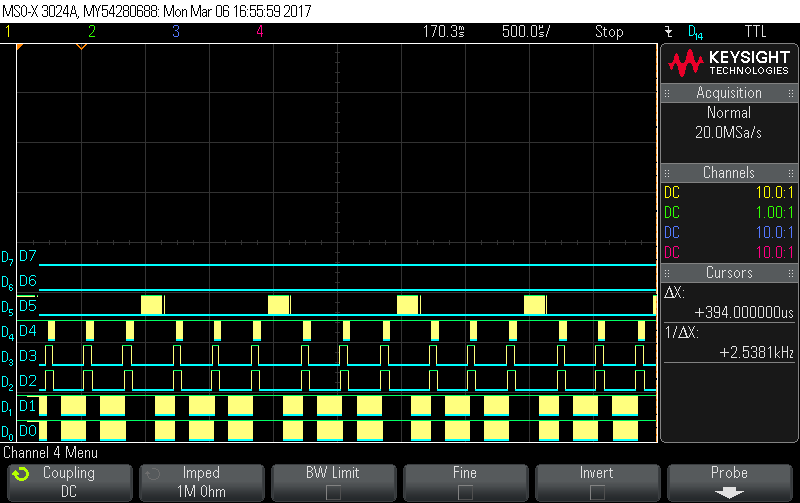
after each 64 byte chunk, the interrupt line goes high and then CS4 starts toggling which illustrates the ISR handling and the EDMA3 read. They both work fine and gives us the expected results.

D0 : Uart Channel 0 incoming data
D1 : Uart Channel 1 incoming data
D2 : Uart Channel 0 Interrupt Line
D3 : Uart Channel 1 Interrupt Line
D4 : Emifa CS4

The Problem :
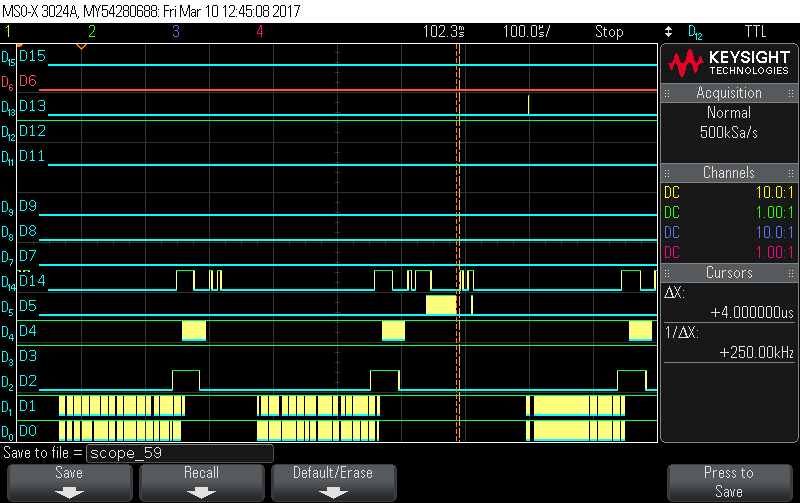
It occured when we started feeding the buffers to the algorithm, whereas, we buffer 2080 samples into a "PingBuffer" (which has the size of 1MB) and we pass it to the algorithm which is running in the main loop. We start filling in the "Pong buffer". Everything keeps working fine until a certain point in time, the ISR gets delayed abnormally and we lose synchronization and therefore, we dont meet our deadline.
The following snapshot illustrates this behaviour.

We read through the forum and most of the manuals available to us and we came across multiple possible reasons for this :
First, the interrupts could be disabled by the compiler. We recompiled all the code used, starting from ours, to the C standard library, Mathlib and DSP lib with --interrupt_treshold = 1. We looked into the assembly output and the "DINT" instructions is never used ( except for some assembly files in mathlib, for which we tried both commenting DINT or reimplement the functions used in C.)
Second, We looked into BUS contention for the mDDR/DDR2 Controller. since the gel File is doing the initialization for us, the default value of the PBBPR was 0x20 which we decreased to 0x10 without any effect on the problem.
Third, Since the CPU does not allow nested interrupts in hardware, we made sure that we only program the Uart interrupt (for test purposes only)
Forth, The current configuration of the master peripheral registers gives higher priority to the used DMA Controller (which is both the default, and desired configuration).Giving a higher priority to the CPU, doesnt change anything in the this delay.
Now that we have tried all these, we started to suspect that it is a caching problem. Could cache misses in L1P cause this long delay ? If So, what can we do about it?

EDIT : we tried linking the algorithm text section into DDR2, and all the rest in L2RAM space and we got the same result.


We are also open to any suggesttions to help us with our issue.

Thank you in advance.
Regards,

  • Hi Bery,

    I've forwarded this to the design experts. Their feedback should be posted here.

    BR
    Tsvetolin Shulev
  • Bery,

    From the logic analyzer shots, I assume D0/D1 are physically the UART's Rx input lines and you said that D4 is the EMIF CS4. What physical signals are D2, D3, D8, D10, and D11? My assumption for D2-D3 is that those are your two GPIO lines, but what physical signals from the UART are they; and what clears them? Also, why are D8-D11 not shown in the second picture? Can those be captured to add some visibility to what is happening?

    In the first picture, the width of D3 seems to vary by up to 2x from the narrowest pulses to the widest. Is that just a sample/display artifact or does it indicate something taking more time on the DSP to complete?

    When the failure occurs, D3 gets stretched out, which implies it gets cleared only after some action from the DSP. Is that 'action' the completed reading of 64B or some other direct signal or command? At that same point, D2 does not get cleared, so it's clearing action must not be taking place (duh, right?). Does that point to anything in particular for you?

    When the lockup occurs, what were the last things to happen with the ISRs and the EDMA? In other words, are you stuck in an ISR waiting for something? What have both EDMA operations done?

    I really don't want to take anything off the table, but the experiments you have done with moving ISR code to L2SRAM, turning off other interrupts, and playing with priorities, all combine to hint strongly that it is not an issue with execution time. Since that is a very common cause of realtime issues, it will be good to keep it in mind and even try more things from time-to-time. For example, you could turn off L1P cache and alternately L1D cache and L2 cache to see the effects.

    How repeatable is the failure? Does it tend to happen the same amount of time after starting to send data to the UART? Does it always start stalling after the 3rd burst of a 192B burst?

    Since 2080 is not evenly divisible by 192 or 64, how is something new happening in terms of switching from ping to pong and starting the algorithm-in-main to run?

    If you skip over or comment out the algorithm code so all you are doing is reading the data in and whatever else the ISRs do, does the problem still happen?

    What all is happening in the ISRs?

    What are the parameters you are using for the EDMA transfers? Is the EDMA only reading from the EMIF to memory, or is it also moving data around after that data gets saved to DDR?

    Regards,
    RandyP
  • Hello Randy,
    You guessed right : D0/D1 are the physically the UART RXs, D4 is the EMIF CS4, D2 and D3 are the interrupt lines connected to GPIO lines. I must apologize for not mentionning that all the others lines are unrelated to our matter ( we are monitoring other signals going to another CPU ).

    About the interrupt lines ( D2/D3 ), if the Uart has an interrupt pending ( such as framing error, overflow error or the most important case, trigger level reached ) it fires up the corresponding interrupt line. as you can see in the snapshot, both lines go high at the moment because, the trigger level has been reached. To be more precise, the interrupt goes up in the starting bit of the 61st byte and down as soon as the bytes in the fifo drop below the trigger level which is 60. ( if ther are no other interrupts pending )
    So, in the snapshot, you can see that there are 2 contiguous equal chunks of CS4 toggling, they represent the EDMA3 reads from the 2 uart channels. D3 goes low as soon as the first chunk start going, D2 then gets low when its corresponding read gets performed.

    The interrupt gets streched out because the interrupt didnt get serviced as soon as the 61st byte got into the fifo. We clear the flags and manually trigger the edma3 read from the Fifo scope.

    We are not stuck, its just when the interrupt gets delayed, the next 64B chunk has already started being sent when the DMA starts emptying the FIFO. The interrupt goes high when the FIFO reaches 61 bytes-  but if the FIFO isn't empty at the start of the 64 byte chunk, we'll get an overflow and lose critical data.


    It consistently occurs 160ms after we finish gathering the first 2080ms of data. Commonly in the first chunk of 64Bytes but less frequently at the second. However, when we tried turning on/off L2, L1P, L1D in all possible combinations, the same behaviour occurs but at different samples. ( but for each individual trial, they are consistent )

    When the last DMA transfer exhausts its parameter ( an AB transfer with Cidx = 2080 ), it triggers a completion interrupt, in which we set both a new parameter for the DMA transfer, and a global variable, which tells the algorithm to run in the main loop.

    the first snapshot we linked in the previous post illustrates how everything works fine when the algorithm is commented out. We never had any problems and it never fails ( longest test was conducted for 2 days )

    What happens in the ISR is as follows : Disable the BANK interrupt, Clear its flag, Clear the pin Interrupt, read the status registers from the different uarts ( which gives enough time for the last 3 bytes to be latched in the FIFO ) then Enable the EDMA3 transfer and renable the Bank interrupt.

    We are using chained events for the DMA :
    param 1: peripheral to memory ( first uart channel to buffer )
    param 2: peripheram to memory ( second uart channel to buffer )

    param 3 : data reordering ( memory to memory )
    param 4 : memory to peripheral ( we send what we gather directly to another asynchronous peripheral which is connected to the other CPU i mentionned earlier )
    param 5:  Memory to memory (the ping pong buffers)

    As I mentionned, the DMA transfers are performed correctly and we get the desired behaviour and output, and yes, its moving data around.
    From a hardware design point of view, what makes you think it's not related to execution time?
    Thank you,

  • Bery,

    I think I am confused from your "Functional design :" description in your original post. Samples and milliseconds seem to be used interchangeably, but that is unclear and confusing to me. Perhaps you can reword that with some added detail to help me, please?

    How many bytes of data are in each of the three expanded bursts in the lower left corner of the Mar 6 11:22 picture, above? I am trying to understand exactly what all is going on, which is the only way I know to be able to come up with helpful suggestions. From the picture, it appears only a few bytes are added to the FIFO after D3/D2 go high, but a lot of bytes are read before D3 goes low. Then a more dense set of reads occur before D2 goes low.

    What explains the apparent slower reading from the UART while D3 is still high?
    What then explains the faster reading while D2 is high? Probably similar issue present then missing?
    Do you have two separate ISRs, one for Channel 0 and one for Channel 1? Or a single ISR waiting for either? Or what else?

    The terms 'link' and 'chain' have very specific meaning in the use of the EDMA3. Can you explain please what chaining you are using with the several params, please? And how that is controlled. Do you mean that you are using a total of 5 DMA channels with chaining from one to the next depending on the point in time? If the problem has nothing to do with execution time, then it will most likely have something to do with EDMA3 resource management - managing the available channels and transfer controllers and buses and so on.

    I find it helps to provide Memory Browser pictures of the Param area using 32-bit TI format and 8 words per line. And identify which physical address starts which of your logical param sets. Also include any link sets that you are using.

    You said you are using "an AB transfer with Cidx = 2080". What are the Acnt and Bcnt values? What is your EMIF configured for in terms of bus size? How are the UARTs wired for the the FIFO and register access - a few address lines, many address lines, or no address lines?

    And, how do you trigger each of the 2080 DMA transfers?

    Turning on and off L1P should make a big difference in the time it takes to execute code. Doing the same for all caches (all off vs. all on) should easily vary execution time by as much as 10x. Since that big variation is not dramatically shifting your problem, it is less likely.

    By the way, commenting out DINT instructions in the library code can be destructive to the algorithms being run. We try to be very careful in the placement and use of those to minimize any effects on interrupt latency, but if an interrupt occurred in the middle of a loop that should have been DINT'ed, bad things will happen to your data.

    Reaching out for a guess as to the cause of your problem: You have listed 5 different DMA things that are going on, and most of them do not happen during the routine data transfer period. When the time comes to do a bunch of larger transfers, things get slowed down a lot. So there is most likely either too much activity for the memory buses to handle (not the most likely cause) or too much activity for the EDMA3 to handle. More details on the DMA configurations and operation will help figure that out.

    Regards,
    RandyP
  • Thank you for the fast answer Randy,

    a data sample is composed of 3 chunks of 64 bytes, coming from 1 of the uarts. so on an individual channel, a sample is equal to 192 Bytes. a data sample is generated each 1ms, hence the confusion between the two.
    The uart device has 2 interrup lines connected to GPIO which go high when it has something to be serviced : for example : Line status registers, FIFO full, trigger level reached etc.
    in our case, when the interrupt goes high at the 61st byte of each 64 byte chunk, we perform some reads from quad uart with the CPU from the EMIFA_CS4 which explains shape of D4 on the snapshot "March 6 11:22". The first spaced CS pulses are performed by the CPU, then the 2 dense pulses are performed by the DMA when it gets triggered by a manual event inside the same ISR. The reason why the first reads take so much time is because we need to make sure that we received exactly 64 bytes, and since the device sending those bytes can get some delays between bytes and there are no ways to tell if the fifo is full, we need to ensure that we give it enough time to fill the FIFO (in our case, 34 micro seconds).
    Also, as I mentionned before, the 2 interrupt lines share the same GPIO Bank, so we only enable INT-0 which you can see on D2. So, we only have 1 ISR.

    Heres in brief a summary of the system which might help you visualise it :
    In a millisecond base, we receive 1 sample ( 3 x 64B chunks) from each UART channel.

    for each 64 byte chunk we get an interruption on the 61st byte, which clears the Line status registers and give enough time for the last 3 bytes to be received, then we enable a DMA transfer which is chained to another one, they both read data from the coressponding UARTx RHR registers.
    Once this is achieved for each sample ( aka 1ms, or 3 chunks of 64 bytes from each channel), we perform some data reordering and padding with DMA.
    At this point, the data is considered ready to be processed and sent out, so we send manually trigger a DMA transfer to EMIFA_CS2 (D5 on the next snapshot) which is chained to another transfer which puts the same data into the ping pong buffers usable by the algorithm.


    Here are the paramsets used for the DMA transfers :
    EDMA3CCPaRAMEntry PSet00 = {
        .srcAddr    = (unsigned int)     SOC_EMIFA_CS4_ADDR + QUAD_CS_A,
        .destAddr   = (unsigned int)     Data_Raw                 ,
        .aCnt         = (unsigned short)    1                         ,
        .bCnt         = (unsigned short)    64                         ,
        .cCnt         = (unsigned short)    1                        ,
        .srcBIdx     = (short)            0                        ,
        .destBIdx     = (short)            1                        ,
        .srcCIdx     = (short)            0                        ,
        .destCIdx     = (short)            0                        ,
        .linkAddr    = (unsigned short)    0xFFFFu                     ,
        .bCntReload = (unsigned short)    0u                         ,
        .opt         = (unsigned int)    0x00401004                ,
    };
    EDMA3CCPaRAMEntry PSet01 = {
        .srcAddr    = (unsigned int)     SOC_EMIFA_CS4_ADDR + QUAD_CS_C,
        .destAddr   = (unsigned int)     Data_Raw+(64*3)         ,
        .aCnt         = (unsigned short)    1                         ,
        .bCnt         = (unsigned short)    64                         ,
        .cCnt         = (unsigned short)    1                        ,
        .srcBIdx     = (short)            0                        ,
        .destBIdx     = (short)            1                        ,
        .srcCIdx     = (short)            0                        ,
        .destCIdx     = (short)            0                        ,
        .linkAddr    = (unsigned short)    0xFFFFu                     ,
        .bCntReload = (unsigned short)    0u                         ,
        .opt         = (unsigned int)    0x00101004                ,
    };
    EDMA3CCPaRAMEntry PSetOrder00 = {
        .srcAddr    = (unsigned int)     Data_Raw                 ,
        .destAddr   = (unsigned int)     Data_Ordered            ,
        .aCnt         = (unsigned short)    3*8                        ,
        .bCnt         = (unsigned short)    8                         ,
        .cCnt         = (unsigned short)    1                        ,
        .srcBIdx     = (short)            3*8                        ,
        .destBIdx     = (short)            3*8*2                    ,
        .srcCIdx     = (short)            0                        ,
        .destCIdx     = (short)            0                        ,
        .linkAddr    = (unsigned short)    0xFFFFu                     ,
        .bCntReload = (unsigned short)    0u                         ,
        .opt         = (unsigned int)    0x00403004                ,
    };
    EDMA3CCPaRAMEntry PSetOrder01 = {
        .srcAddr    = (unsigned int)     Data_Raw +(64*3)        ,
        .destAddr   = (unsigned int)     Data_Ordered +(3*8)        ,
        .aCnt         = (unsigned short)    3*8                        ,
        .bCnt         = (unsigned short)    8                         ,
        .cCnt         = (unsigned short)    1                        ,
        .srcBIdx     = (short)            3*8                        ,
        .destBIdx     = (short)            3*8*2                    ,
        .srcCIdx     = (short)            0                        ,
        .destCIdx     = (short)            0                        ,
        .linkAddr    = (unsigned short)    0xFFFFu                     ,
        .bCntReload = (unsigned short)    0u                         ,
        .opt         = (unsigned int)    0x00404004                ,
    };

    EDMA3CCPaRAMEntry PSetPreSort = {
        .srcAddr    = (unsigned int)     Data_Ordered             ,
        .destAddr   = (unsigned int)     Data_Intermediate +1    ,
        .aCnt         = (unsigned short)    3                         ,
        .bCnt         = (unsigned short)    64*2                     ,
        .cCnt         = (unsigned short)    1                        ,
        .srcBIdx     = (short)            3                        ,
        .destBIdx     = (short)            4                        ,
        .srcCIdx     = (short)            0                        ,
        .destCIdx     = (short)            0                        ,
        .linkAddr    = (unsigned short)    0xFFFFu                     ,
        .bCntReload = (unsigned short)    0u                         ,
        .opt         = (unsigned int)    0x00104004                ,
    };
    EDMA3CCPaRAMEntry PSetOut = {
        .srcAddr    = (unsigned int)     Data_Intermediate         ,
        .destAddr   = (unsigned int)     SOC_EMIFA_CS2_ADDR + CPLD_W_PUSH_ADDR,
        .aCnt         = (unsigned short)    1                         ,
        .bCnt         = (unsigned short)    64*2*4                     ,
        .cCnt         = (unsigned short)    1                        ,
        .srcBIdx     = (short)            1                        ,
        .destBIdx     = (short)            0                        ,
        .srcCIdx     = (short)            0                        ,
        .destCIdx     = (short)            0                        ,
        .linkAddr    = (unsigned short)    0xFFFFu                     ,
        .bCntReload = (unsigned short)    0u                         ,
        .opt         = (unsigned int)    0x00105004                ,
    };
    EDMA3CCPaRAMEntry PSetSort = {
        .srcAddr    = (unsigned int)     Data_Intermediate        ,
        .destAddr   = (unsigned int)     Data_Final_Ping            ,
        .aCnt         = (unsigned short)    4                         ,
        .bCnt         = (unsigned short)    64*2                     ,
        .cCnt         = (unsigned short)    2080                    ,
        .srcBIdx     = (short)            4                        ,
        .destBIdx     = (short)            4*2080                     ,
        .srcCIdx     = (short)            0                        ,
        .destCIdx     = (short)            4                        ,
        .linkAddr    = (unsigned short)    0xFFFFu                     ,
        .bCntReload = (unsigned short)    0u                         ,
        .opt         = (unsigned int)    0x00106004                ,
    };
    Also, heres another snapshot illustrating the same problem we had, but with CS2(D5) on it

    Here's how the DMA channels are being initialized :

    void DMA_Set(void)
    {
        /* Request DMA channel and TCC */
        EDMA3RequestChannel(SOC_EDMA30CC_0_REGS, EDMA3_CHANNEL_TYPE_DMA, 0, 0, 0);
        EDMA3SetPaRAM(SOC_EDMA30CC_0_REGS, 0, &PSet00);

        EDMA3RequestChannel(SOC_EDMA30CC_0_REGS, EDMA3_CHANNEL_TYPE_DMA, 1, 1, 0);
        cb_Fxn[1] = Snippet_Complete_ISR;
        EDMA3SetPaRAM(SOC_EDMA30CC_0_REGS, 1, &PSet01);

        EDMA3RequestChannel(SOC_EDMA30CC_0_REGS, EDMA3_CHANNEL_TYPE_DMA, 2, 2, 0);
        EDMA3SetPaRAM(SOC_EDMA30CC_0_REGS, 2, &PSetOrder00);

        EDMA3RequestChannel(SOC_EDMA30CC_0_REGS, EDMA3_CHANNEL_TYPE_DMA, 3, 3, 0);
        EDMA3SetPaRAM(SOC_EDMA30CC_0_REGS, 3, &PSetOrder01);

        EDMA3RequestChannel(SOC_EDMA30CC_0_REGS, EDMA3_CHANNEL_TYPE_DMA, 4, 4, 0);
        cb_Fxn[4] = PreSort_Complete_ISR;
        EDMA3SetPaRAM(SOC_EDMA30CC_0_REGS, 4, &PSetPreSort);

        EDMA3RequestChannel(SOC_EDMA30CC_0_REGS, EDMA3_CHANNEL_TYPE_DMA, 5, 5, 0);
        cb_Fxn[5] = Data_Out_ISR;
        EDMA3SetPaRAM(SOC_EDMA30CC_0_REGS, 5, &PSetOut);

        EDMA3RequestChannel(SOC_EDMA30CC_0_REGS, EDMA3_CHANNEL_TYPE_DMA, 6, 6, 0);
        cb_Fxn[6] = Sort_Complete_ISR;
        EDMA3SetPaRAM(SOC_EDMA30CC_0_REGS, 6, &PSetSort);

    }

    the function table gets used in the completion ISR and here are their implementations ( We are following/using the examples from the Starterware)

    void Snippet_Complete_ISR(unsigned int tcc, unsigned int status)
    {
        ++Counter_Pivot;
        if(Counter_Pivot == 3){
             Counter_Pivot = 0;
            EDMA3EnableTransfer(SOC_EDMA30CC_0_REGS, 2, EDMA3_TRIG_MODE_MANUAL);
        }
        PSet00.destAddr     = (unsigned int) Data_Raw+(64*Counter_Pivot);
        PSet01.destAddr     = (unsigned int) Data_Raw+(64*(3+Counter_Pivot));
        EDMA3SetPaRAM(SOC_EDMA30CC_0_REGS, 0, &PSet00);
        EDMA3SetPaRAM(SOC_EDMA30CC_0_REGS, 1, &PSet01);
    }
    void PreSort_Complete_ISR(unsigned int tcc, unsigned int status)
    {
        EDMA3SetPaRAM(SOC_EDMA30CC_0_REGS, 2, &PSetOrder00);
        EDMA3SetPaRAM(SOC_EDMA30CC_0_REGS, 3, &PSetOrder01);
        EDMA3SetPaRAM(SOC_EDMA30CC_0_REGS, 4, &PSetPreSort);
        EDMA3EnableTransfer(SOC_EDMA30CC_0_REGS, 5, EDMA3_TRIG_MODE_MANUAL);
    }
    void Data_Out_ISR(unsigned int tcc, unsigned int status)
    {
        EDMA3SetPaRAM(SOC_EDMA30CC_0_REGS, 5, &PSetOut);
        //VSYNC
        (*(volatile uint16_t*)(SOC_EMIFA_CS2_ADDR + CPLD_W_VSYNC_ADDR)) = (uint16_t) 0xAB;
        EDMA3EnableTransfer(SOC_EDMA30CC_0_REGS, 6, EDMA3_TRIG_MODE_MANUAL);

    }
    bool buff_swap=1;
    void Sort_Complete_ISR(unsigned int tcc, unsigned int status)
    {
        if(buff_swap){
            PSetSort.destAddr   = (unsigned int)     Data_Final_Pong;
            buff_swap =0;
        }
        else{
            PSetSort.destAddr   = (unsigned int)     Data_Final_Ping;
            buff_swap = 1;
        }
        ARRAY_GO=1;
        EDMA3SetPaRAM(SOC_EDMA30CC_0_REGS, 6, &PSetSort);
    }

    I hope this enough details to give an exact idea of how the system works.
    Thank you,

  • Bery,

    All the Param settings and ISR code show what happens for every sample or ms. To confirm my understanding that I am going with, this is my rewording of it:

    There are three UART bursts on D0/D1 with each followed by a D4 burst when DMA channels 0/1 are run to read the incoming UART data. After the 3rd of each set of three bursts, DMA channels 2-4 run, followed by channel 5 which is shown on D5. The D5 burst and final write (0xAB data value) occurs at about the midpoint of the next UART burst on D0/D1, so about 40-50 us before D0/D1 go high.

    In all of the passing cases, the D4 activity on CS4 starts quickly after D0/D1 go high. But in the failing case in the latest Mar 6 16:58 picture, there is an additional delay before the D4 activity starts.

    I assume from your descriptions above that this failing situation happens when the last of 2080 'samples' has been received. That means the exact same DMA activity happened all the way through all the DMA ISR up to and including the Sort_Complete_ISR for DMA channel 6. The difference in Sort_Complete_ISR for this last sample is that ARRAY_GO is set to 1 and the Param for channel 6 is reloaded.

    What happens in the main routine when ARRAY_GO is set to 1? Especially, does any additional DMA activity occur?

    Are any other DMA channels used for anything other than the ones shown above?

    If you spread out the space between samples, does the problem go away?

    Once the failure has occurred, there are several EDMA3 registers that could indicate EDMA3-related errors, such as EMR or even IPR.

    Since there is a big lag between our posts, I recommend you look through the EDMA3 User Guide about Linking if you have any extra time. Also, look for Starterware examples with linking. I am not familiar with the Starterware code, but I assume your methods of using ISRs and manual triggering are based on Starterware examples. If you can send me the names of any of those examples, I can see if I have those loaded on my PC.

    Regards,
    RandyP
  • Hey Randy,
    Thank you again for taking time to read and understand all the parts of the system.
    You got everything right except for "the problem part".
    After 2080 samples are received (the first ping buffer is filled), we set the "ARRAY_GO" Variable which sets the algorithm to run in the main loop of the program on this data.
    The algorithm takes about 700ms to finish working on the PingBuffer and at that same time, the DMA its still filling the PongBuffer.
    the program execution is flawless for 160ms after ARRAY_GO is set to 1, (if all caches are enabled, otherwise it happens later), and on the 161st ms ( or 161st 3-chunk sample ), we get that weird delay. If ARRAY_GO is never set to 1, the ping/pong buffers get filled one by one and the DMA transfers dont get delayed.

    There are no other DMA channels used other than the ones mentioned in my previous post.

    The DMA doesnt register any errors, the ISR is already implemented in the Starterware as descreibed under examples/spi_edma or examples/uart_edma. The routines for dealing with completion and errors are described in the EDMA3 reference manual (Section 2.9.2 EDMA3 Interrupt Servicing ) as pseudo code which coressponds to the implementions of these ISRs in the starterware ( Check Edma3ComplHandlerIsr and Edma3CCErrHandlerIsr )
    So the problem is not about the DMA finishing its job, its about the interrupt not being serviced right away.

    Also, not all DMA channels are chained*. We have 0,1 chained* and 2,3,4 chained*. 2 is triggered by a callback function from the completion ISR after channel 1. Same goes for channel 5 and 6. As you might imagine, there are multiple ways of doing the same thing, we just opted for a more controlled way ( we can check the status of all transfers when debugging).

    Edit : We put bigger delay between the 64 byte chunks and we noticed that the failure happens at 76th sample instead of the 161st. You can see that the 5th DMA transfer ( displayed on D5) gets delayed too.
    This strongly suggests that its an execution issue because now we gave more time for the CPU to perform the algorithm and the failure seems to happen sooner.


    We agree that there is a long delay between posts on this forum - is there any way we could contact you or another FAE directly to help expedite the process? We can post the solution here to the benefit of the forum.

    Regards,

  • Bery,

    A lot of good information, and this latest picture is great.

    I am curious what IPR and IER from the EDMA3 registers look like after stopping the processor after the failure occurs. Are there enabled bits set in IPR, like either bit 1 or bit 6? Or others?

    How is DMA channel 0 triggered? Is it event triggered by the GPIO rising edge, or is there an ISR not shown that responds to the GPIO rising edge, reads from the UART and then decides whether to manually trigger DMA channel 0?

    Since cache on/off does change the occurrence of the failure significantly by moving it earlier or later, that changes things. And that matches up with the failure staying at about the same point in time after the 700ms processing begins, which is earlier or later in sample counts depending on the spacing between the 64B chunks. And especially that never setting ARRAY_GO avoids the problem completely, you have convinced me that it is processor performance related and not EDMA3 resource related (which was the path I was heading down).

    I can see going one or both of two directions: 1) determine exactly what in the code is causing the delays and 2) reduce the DMA activities' dependence on processor performance (esp. ISR latency). For 1) you can either fix it if possible or deal with it if possible. And 2) might be a way to deal with it if fixing is more difficult.

    Since the failure happens during the first pass through the algorithm in the main program, there are a variety of ways to find it. If it is easy to restart the code and external devices, then guessing at where the 160ms point is and putting a return there would allow you to see if the failure occurs or not. If not, move the return earlier; if so, move the return later.

    Another way would be to put in a 100ms interruptible delay loop in the code instead of the return. If the delay causes the problem to move later by 100ms, move it earlier, and so on.

    The two biggest culprits I can think of are interrupts being disabled or memory bus conflicts. Interrupts can be disabled by another interrupt that does not allow nesting, or by explicit use of DINT/EINT, or by 1-6 cycle tight loops. You should know if any other interrupts could be active at the bad time, and they would have to be repeating a lot to cause what you are showing here. Explicit use of DINT/EINT is required for max performance for some algorithms; sometimes there is a tradeoff that allows less use of DINT/EINT but sacrifices a little performance - that would be very specific to your code. Tight loops are unlikely in TI library routines and can be avoided with the interrupt compile flag that you already mentioned using.

    So if it is memory bus conflicts, it would mean the DSP is doing a lot of data memory access in big chunks in a small loop at the same time as the DMA channel 6 transfer since it is the longest one so the most likely to get stalled. But again, it all depends on how the code operates and what it is doing.

    In EDMA3 terminology, you are using chaining to trigger a transfer on the next channel automatically. Linking would be very useful for your case; it would mean having another copy in a special Link Param set of what you would normally reload in your ISRs into the active channel param set for each of the channels. Using linking could completely get rid of some of the ISRs that you are using to reload the param. You can even use several Link Param sets in a row to have the three different addresses for channel 0 or the ping & pong addresses for channel 6. Doing this would be a way to implement #2 "deal with it if fixing is more difficult". But it would not be a guarantee unless you can find the actual cause so you can know that more immunity to interrupt latency would succeed in the worst case, and not just move the problem farther down the road where it is harder to find.

    The overlap between D5 and D4 was very puzzling to me since you are putting all of the DMA channels on Queue 0 / Transfer Controller 0 where they 'should' always happen sequentially and not in parallel. But really it is reads that have to happen sequentially. My theory is that the Ch5/D5 reads get started, and when enough data are in the Data FIFO, the Ch5/D5 writes will start. Once all of the Ch5/D5 reads are completed (fast since they are from faster memory than the EMIF), then Ch0/D4 reads can begin. Once enough Ch0/D4 data are also in the Data FIFO, Ch0/D4 writes to internal or DDR memory can start. Meanwhile, Ch5/D5 is writing through the EMIF and simultaneously Ch0/D4 is reading through the EMIF. Since they are sharing the EMIF, they take turns and both get stretched out to a longer time for each to complete.

    Some other things that could be going wrong here, just free-thinking, are:

    - The long delay for reading the UART causes a FIFO overflow in the UART which sets some different bits that could affect future GPIO interrupts.
    - A race condition in the EDMA Interrupt dispatcher could result in no more EDMA interrupts; this would show up as one or more IPR bits being set after all the activity has stopped.

    Regards,
    RandyP
  • Randy,

    The DMA channel is triggered manually on the GPIOPin1Bank0 rising edge.


    void Quad_GPIO_ISR_DMA(void)
    {
        GPIOBankIntDisable(SOC_GPIO_0_REGS, SYS_INT_GPIO_B0INT);
        /* Clear interrupt status in DSPINTC */
        IntEventClear(SYS_INT_GPIO_B0INT);
        /*Get the Pending Event*/
        bool Set = (bool) GPIOPinIntStatus(SOC_GPIO_0_REGS, 3);
        GPIOPinIntClear(SOC_GPIO_0_REGS, 3);

        static uint32_t dummy_delay;
        static uint8_t ISR_reg,LSRA_reg,LSRC_reg;
        for(dummy_delay;=0;dummy_delay;<25dummy_delay;++)
        {
            ISR_reg = (*(volatile uint8_t*)(SOC_EMIFA_CS4_ADDR + QUAD_CS_C + QUAD_READ_ISR));
            ISR_reg = (*(volatile uint8_t*)(SOC_EMIFA_CS4_ADDR + QUAD_CS_A + QUAD_READ_ISR));
            LSRA_reg = (*(volatile uint8_t*)(SOC_EMIFA_CS4_ADDR + QUAD_CS_A + QUAD_READ_LSR));
            LSRC_reg = (*(volatile uint8_t*)(SOC_EMIFA_CS4_ADDR + QUAD_CS_C + QUAD_READ_LSR));
        }
        if((LSRA_reg & 0x01) == 0) QUADA_UART_ERROR =1;
        if((LSRC_reg & 0x01) == 0) QUADC_UART_ERROR =1;


        EDMA3EnableTransfer(SOC_EDMA30CC_0_REGS, 0, EDMA3_TRIG_MODE_MANUAL);
        GPIOBankIntEnable(SOC_GPIO_0_REGS, SYS_INT_GPIO_B0INT);
        
    }

    The dummy reads are the spaced reads going to the quad uart. They are there to make sure that the last 3 bytes of the 64 chunk arrive to the fifo before starting emptying it. ( if we launch the DMA right away, there were frequent cases when the DMA finishes before those bytes get latched)

    Also, the DMA events are chained, not linked. I rectified that in the previous post and we are both on the same page.
    We thought this could be a bus contention issue and as you might know, the DMA has a higher priority in SCR, and we limited the the EMIFDDR_PBBPR to 0x10.

    I'm in the process of checking with the developers of the algorithm to gain insight into it's processes - it was developed by a different team.

    The arbitration which happens between D4 and D5 is the effect of the delay of the first 3 D4 reads ( 64 bytes chunk ) which are followed by a D5 write. at that last transfer, D4 was triggered again, and the DMA had to arbitrate between reading and writing from both channels.
    You are also right, missing the FIFO interrupt and/or not emptying it at the right time will keep the pin high and thus, we wont be able to deal with it anymore. (that is also an effect of the fundemental problem )
    The EDMA interrupts are correct. there are no pending flags in the IPR when we hit that stage. So it is most likely about the Interrupt being not serviced in time.

    We will try the event triggering of DMA instead of manual triggering in an ISR.

    To speed up the communication process, is it possible to request some sort of direct contact with either you or another TI FAE?

    Thank you,

  • RandyP said:


    The two biggest culprits I can think of are interrupts being disabled or memory bus conflicts. Interrupts can be disabled by another interrupt that does not allow nesting, or by explicit use of DINT/EINT, or by 1-6 cycle tight loops. You should know if any other interrupts could be active at the bad time, and they would have to be repeating a lot to cause what you are showing here. Explicit use of DINT/EINT is required for max performance for some algorithms; sometimes there is a tradeoff that allows less use of DINT/EINT but sacrifices a little performance - that would be very specific to your code. Tight loops are unlikely in TI library routines and can be avoided with the interrupt compile flag that you already mentioned using.

    Processor in question is SPLOOP-capable, which means that it can achieve top performance in tight loops without disabling interrupts. It only adds some delay to interrupt response time, this is the compromise. But it's very good compromise, because otherwise performance difference between --interrupt_threshold=1 and no-such-flag can be several times. This is naturally provided that SPLOOP is actually used.

    RandyP said:


    So if it is memory bus conflicts, it would mean the DSP is doing a lot of data memory access in big chunks in a small loop at the same time as the DMA channel 6 transfer since it is the longest one so the most likely to get stalled. But again, it all depends on how the code operates and what it is doing.

    Above mentioned delay to interrupt response is normally just handful additional cycles, but it does depend on memory access stalls. In other words if data is in cache you will hardly notice difference, but in worst case it probably can be few microseconds, very few though. What's the scale again? Is it possible that that's what we see in 6th and 7th D2/3 responses? I.e. that by that time computational part starts and stands for additional delay in interrupt response time [because of memory access stalls]? Then memory bus conflicts could explain the 8th response. That's where conflicts between computational part and DMA [can] occur, and that's why it's longer, right? But by 9th response there are no conflicts between computational part and DMA, yet response is even longer than 8th. Of course computational part might be doing something else than initially, i.e. by 6th and 7th responses. However! If there are SPLOOPs involved difference should not be that large between different parts of program. I mean if SPLOOPs tend to suffer from memory access stalls, all SPLOOPs are likely to add approximately same delay irregardless on what they are doing. [At least with cache on, as with cache off some SPLOOPs can add more delay than others...]

  • Couple of clarifications.

    Andy Polyakov said:

    Above mentioned delay to interrupt response is normally just handful additional cycles, but it does depend on memory access stalls. In other words if data is in cache you will hardly notice difference, but in worst case it probably can be few microseconds, very few though.

    It occurred to me that I seem to miscalculate possible additional delay. Access to external memory can be couple of hundred cycles, and I've estimated it as 1us, while it would be less than 1/2us. In other words additional penalties are unlikely to be larger than 1us. Note that non-SPLOOP-ed code is prone to similar penalties as well. In other words memory access stalls affecting interrupt response time is not something exclusively specific to SPLOOPs interrupt response overhead. It's just that SPLOOPs have capacity to make it a little bit worse by having to wait out say couple of stalls in place of just one otherwise. But at any case we are likely to look at [sub-]microsecond delays.

    Andy Polyakov said:

    What's the scale again?

    Distance between 2nd and 5th responses (on last picture) is 1 millisecond, right? Microsecond is 1/1000th of that and you wouldn't spot [sub-]microsecond variations on that picture. And delays in 6th and 7th responses appear to be in 100-microseconds order of magnitude. In other words it looks more like interrupt being disabled/inhibited than penalties caused by memory bus conflicts. In other words among two suggested culprits I'd say that first is more likely...

  • Hello Randy and Andy,
    I think that it's not data access issue, but rather Interrupts being disabled. I've conducted more tests on the described behaviour and here is the method :
    D14 goes high in the entry of the GPIO ISR triggered by the rising edge of D2 and goes low when its about to exit.
    D14 goes high when the DMA Completion interrupt is called, goes low before jumping to the callback function
    D14 g oes high when at the entry of the callback function, goes high when its about to exit it.
    In the first snapshot, you can see that it takes 4 microseconds after a the DMA 2 64byte chunks transfer is completed to go to the completion ISR ( in reality it takes 5 microseconds but we needed a large scale in order to catch this moment)

    The second one also ilustrates the same delay between the DMA transfer on D5 completion and the triggering of its interrupt ( about 4 to 5 microseconds )

    The first time a delay happens is illustrated by the following snapshot:


    As you can see, D14 goes high almost 400 microseconds after the DMA transfer on D5 has completed rather than 4 to 5 microseconds in the normal behaviour.
    That slows down the processing of the interrupt coming from D2 which will trigger the DMA read on D4.


    This happens again after the DMA transfer has completed on D4, and i takes 388 micrseconds to get to its completion interrupt.

    I think that the problem is the interrupts are being disabled somehow.
    If the interruptions are not disabled by the compiler, what else could be causing this?
    Regards,

  • Bery,

    This is a lot of great data, but it will take me a while to completely understand it. Andy may be faster.

    In my opinion, the most straightforward approach would be to narrow down to where/when in your code that the problem is occurring. Since the problem is predictable and repeatable, and controllable (can be moved later by code changes), you can use code breakpoints or delay loops or early exits to find at least a range of code that is causing the problem.

    I hope that is reasonable as a path to try.

    Regards,
    RandyP
  • Bery Saidi said:

    I think that the problem is the interrupts are being disabled somehow.
    If the interruptions are not disabled by the compiler, what else could be causing this?

    All possibilities were either mentioned or implied already. As Randy mentioned, it can be a logical mix-up in interrupt service routines [not handling nested interrupts correctly]. Unfortunately this would be something that only you can sort out. Compiler can disable interrupts for short times, but it shouldn't do it, especially if it generates SPLOOPS. In other words double-check that. That you do use -mv6748 command-line option and examine assembly output. You mentioned that computational part is provided by somebody else. If they use assembly it it possible that they use loops shorter than 6 cycles (as Randy mentioned such loops would keep interrupts postponed without explicitly disabling them)? If they do, then they should re-implement  code with SPLOOPs.

  • Bery,

    What have you been able to track down in the main routine? Is it getting narrowed down to a single routine or function?

    After studying your screen shots, I see your reasoning for it being interrupt related and not bus contention related.

    Regards,
    RandyP
  • Hello,

    Sorry for the delay, we have been able to find the problem without dichotomic search inside the code.
    Here are the list of things we changed :
    - The algorithm which disabled the interrupts was compiled with interrupt_threshold=1000,and used 2 mathlib functions. We decreased the interrupt threshold to 1 and reimplemented the functions in pure C.
    - We realised we were relying on wrong PLL configs, and we got the board to "really" run at 456Mhz, and emifa at 100Mhz. Unfortunately, we don't have any test points for the emifa clocks or any other PLLs, so we were relying exclusively on AISgen utility.
    Then we tried configuring the system with the spreadsheet from processors.wiki.ti.com/.../AM18xx, and with some calculations of EMIFA clock related to the Setup/Strobe/Hold values we fed it, we are now positive that the board is running as fast as it can.
    - We did the same thing for DDR2 which was also clocked at 75Mhz. Not its speed has doubled.
    Summary of all these changes :

    - Mathlib uses "DINT" instructions in its code. So the algorithm is reimplemented without it.

    - We ensured the board was running at 456Mhz, 100Mhz emifa, 150Mhz DDR2.

    Now, the system meets its hardtime deadlines and the ISRs are called 3microseconds after the flag has been set.

    I would like to thank you for all the time and effort you put in our issue. You have been very helpful!

    Thank you too for your contribution, All the details you mentionned helped narrowing the problem down to a couple elements.
    Regards,

  • Bery Saidi said:

    - Mathlib uses "DINT" instructions in its code. So the algorithm is reimplemented without it.

    Out if curiosity which 2 functions? :-)

  • log10sp and logsp.
  • Bery,

    Can you also specify the version of MATHLIB so that we document or file a bug report for this software.

    Regards,
    Rahul
  • Hello Rahul,
    Sorry for the delay. Mathlib/DSPLib have no bugs. It is by design meant to optimize performance by disabling the interrupts.
    I had to use the C natural version and recompile them with --interrupt_threshold=1.
    Thanks,