This thread has been locked.

If you have a related question, please click the "Ask a related question" button in the top right corner. The newly created question will be automatically linked to this question.

MSP430FR2632: How to interface custom board to CapTIvate Design Studio?

Part Number: MSP430FR2632
Other Parts Discussed in Thread: CAPTIVATE-PGMR

My team is creating a board with multiple capacitive sense inputs, and plan on using the MSP430FR2632 with CapTIvate inputs. 

We want to use the CapTIvate Design Center to both generate firmware for the product as well as to display real-time capture counts and all of the other graphical things you can do at run-time to fine tune the cap sense settings for our application, while the firmware is running on our custom hardware

The TI documentation and online tutorials for using CapTIvate Design Center seem to be based on a TI evaluation board hooked up to the development PC, but we want to be able to do all of this on our own hardware. 

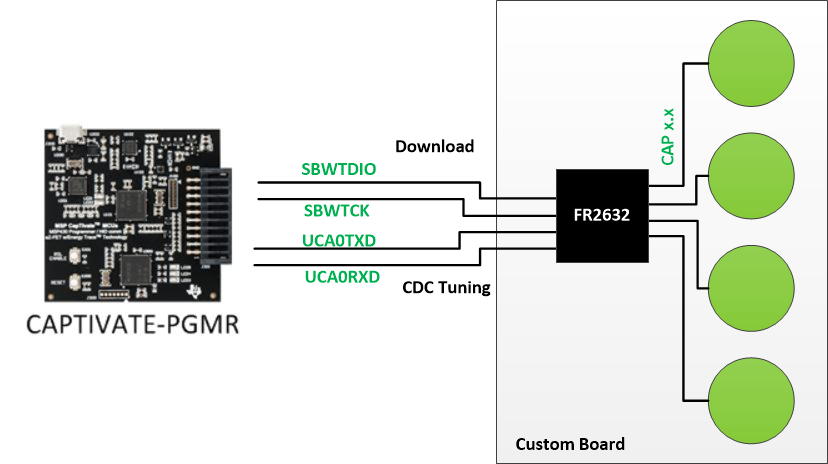
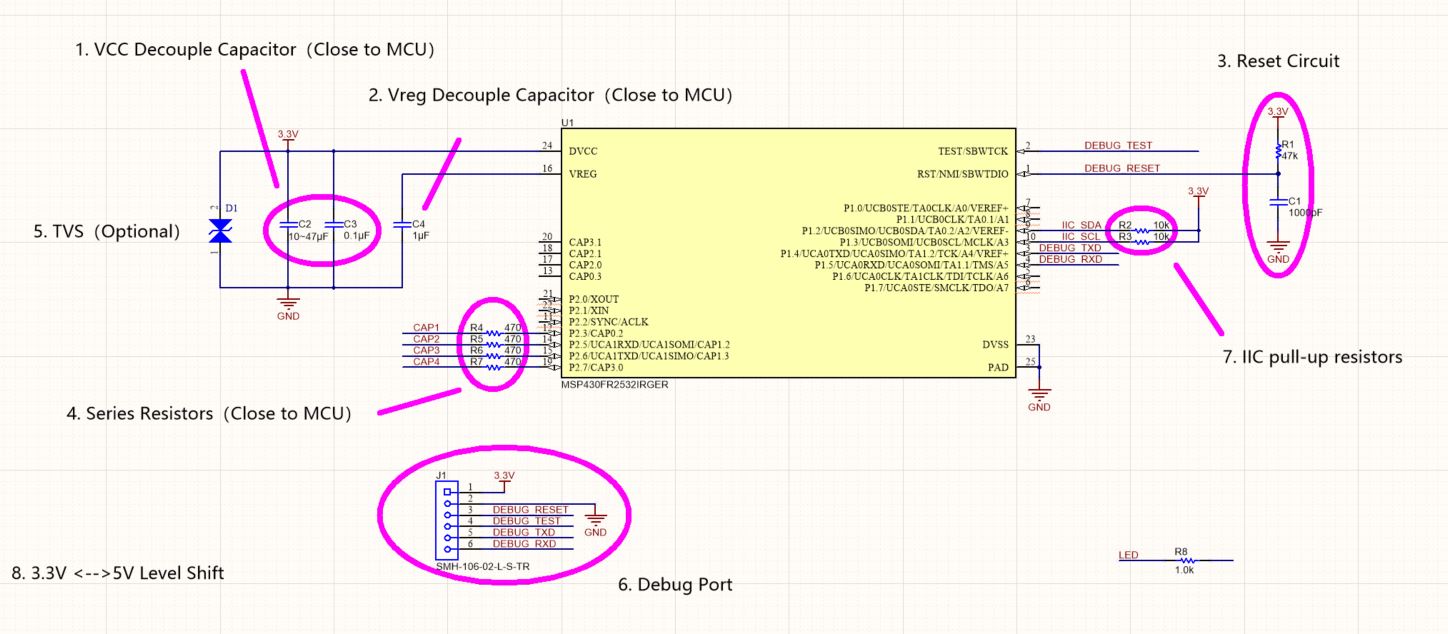
What documentation exists that shows the entire path from our custom board all the way to the PC running Design Center?  How do we design our hardware to accommodate a connection from the MSP430FR CPU on our board, through whatever adapter is necessary, to a USB port on the development PC? 

What pins on the MCU do we have to reserve for communicating with with the debugger as well as relaying run-time data to Design Center?

  • Hi Bob,

    Thanks for you post.

    You need CAPTIVATE-PGMR tool to download code and on-line tuning.  

    Ling

  • Thanks. That was helpful.

    One more related question. We had planned on routing the following pins to a connector that we can attach to for downloading / debugging code on the hardware: RST, TEST, TCK, TMS, TDI, TDO. In the past we've used the TI "MSP FET Flash Emulation Tool" to connect to these JTAG pins for debugging.

    In your block diagram the pins you show conflict with these JTAG pins. Is the CAPTIVATE-PGMR board a complete replacement for the MSP FET Flash Emulation Tool, so that if we only connected the CAPTIVATE-PGMR board to our target we could simultaneously download code and run the code from the Code Composer Studio debugger while also simultaneously using CapTIvate Design Studio for run-time tuning of the sensors?
  • Hi Bob,

    Regarding to download/debug: MSP430FR2632 support both JTAG and SBW interface. We recommend customer to use SBW interface because there only 2 pins are needed. eZ-FET on all launchpad uses SBW interface to download and debug the code in the target MSP430.

    CAPTIVATE-PGMR includes two parts: eZ-FET and CAPTIVATE communication bridge. eZ-FET provides SBW debug interface to download and debug the code for target MSP430. CAPTIVATE communication bridge provides UART and IIC interface for run-time tuning of the sensor. So if you have CAPTIVATE-PGMR then you don't need MSP FET any more.

    If you plan to routing debug and tuning signals to a connector, here is the recommendation: VCC GND TXD RXD SBWTCK SBWTDIO

    Ling
  • We just received our first boards and can't get the CCS debugger to attach to the target.  I'm using CCS v8.0.0.00016.

    The pins we used between the CAPTIVATE-PGMR and the target are the ones you proposed:  VCC GND TXD RXD SBWTCK SBWTDIO

    The CAPTIVATE-PGMR is recognized correctly and all device drivers installed automatically. 

    Is there anything we have to do in the debug configuration in CCS to tell the debugger to use SBW instead of JTAG signals?

    Is there any technical documentation about what we should see on the SBWTCK and SBWTDIO wires with a scope during a successful connection to the debugger?

  • Hi Bob,

    There are 2 items you can check:

    1. make sure there are decouple capacitors on VCC pin

    2. make sure the capacitor on RESET pin is no larger than 1000pF

    Here is a reference schematic.

    Ling

  • Thank you. I believe our design complies with the requirements you stated.

    Can you provide a scope capture showing what we should see on these signals when attempting to attach to the board with a CCS debugger?

  • We found today that completely removing capacitor C1 shown in your schematic allows us to connect with the debugger and CapTIvate Design Studio is working with the board.

    Thank you for all of your help on this matter.

  • I originally used a 2200pF Cap and it didn't work. Based off this I lowered it to 100pF and it still did not work. I removed the C1 cap completely and now it works. What is the risks of removing that capacitor from the design?

  • Hi Nick,

    Reset pin will be more sensitive without capacitor.

    Regards,
    Ling

**Attention** This is a public forum