This thread has been locked.

If you have a related question, please click the "Ask a related question" button in the top right corner. The newly created question will be automatically linked to this question.

CCS/TM4C1294NCPDT: XDS100V3 and TM4C1294XL DAP issues and (Error -1170 @ 0x0)

Part Number: TM4C1294NCPDT

Tool/software: Code Composer Studio

Dear Texas Instruments TM4C and XDS100V3 users.

I have an issue when using the XDS100V3 debugger, that I lose the DAP access. For reference, I have included datasheets here for the parts:

XDS100V3: https://www.olimex.com/Products/DSP/Emulators/TMS320-XDS100-V3/resources/TMS320-XDS100v3_UM.pdf
TM4C1294XL Schematic: http://www.ti.com/lit/ug/spmu365c/spmu365c.pdf

The debugger is configured to use ARM 20 pin JTAG interface, as depicted by the datasheet (installed jumper ARM_JTAG_E). The TI 14 pin interface has aswell been tested, (uninstalled ARM_JTAG_E) with the same failure, as I will describe below. 

The debugger is then configured in CCS as shown on following figure:

The debugger is connected to the JTAG-in (U6 - JTAG_ARM_10PIN) on the TM4C eval. board, to bypass the ICDI debugger. The connection is established through a homemade cable, that connects as shown below:

From:
XDS100V3
To:
TM4C1294XL
TMS TMS
TCK TCK
TDO TDO
TDI TDI
TRST \RESET
GND GND
GND \EXTDBG

That is my test setup. I am running a large software project, that normally runs whenever the debugger is set in run mode - but always halts when I am jumping over the same analog initialization code in the system. The code error I get when the program halts is the following:

CORTEX_M4_0: GEL Output:

Memory Map Initialization Complete

CORTEX_M4_0: JTAG Communication Error: (Error -1170 @ 0x0) Unable to access the DAP. Reset the device, and retry the operation. If error persists, confirm configuration, power-cycle the board, and/or try more reliable JTAG settings (e.g. lower TCLK). (Emulation package 7.0.188.0)

CORTEX_M4_0: Failed to remove the debug state from the target before disconnecting.  There may still be breakpoint op-codes embedded in program memory.  It is recommended that you reset the emulator before you connect and reload your program before you continue debugging

The error also happens randomly when inserting breakpoints.
As explained above, the code can run through the point, but when the code is then paused (in debug mode), the same error will happen at random points in the code, very in-consistently.

I have searched on the web and this forum for similar issues, but have not been able to find any users with the -1170 error code. Anyone can help me out on this one? I can provide more detailed code if needed, but I would like to introduce the general lines before getting into too much detail, since there might be an easy fix for the experienced user of the XDS100V3 along with the TM4C series.

Thank you very much for reading this - any comments that can help to debug the issue is appreciated. 
Will keep you updated.

Best regards,
JC

  • Hello Carlsen,

    I am familiar with the DAP -1170 error but it almost always presented itself as a hardware problem. As you are using the LaunchPad, I assume you didn't make any changes beyond hooking up the JTAG cable?

    In the few cases that DAP -1170 occurred due to software the issue was due to execution of incorrect code like setting SysClk incorrectly.

    Can you describe what the code which the error occurs on is? Posting it with the code insert tool (see the </> symbol after clicking the "Insert Code, Attach Files and more..." option) would help us review and see if anything is amiss from that standpoint.
  • Dear Jacobi.
    Thank you very much for the answer! The issue did indeed appear on our developed hardware, but after using the evaluation kit (TIVA) with the debugger, we were surprised to see the exact same issue happen. We were suspecting hardware to be the issue, but it is hard to tell the issue, when it is appearing on the TIVA as well.
    No changes have been done to the TIVA kit, since I read somewhere in the manuals that the debug IN option is available without modification of the board. I am powering the TIVA through the OTG (with the jumper config).

    I am providing here to most abstract code snippet, where the issue happens. When I am stepping over the functions, the error appears when stepping over "IO_Analog_Initialize();":

    void IO_Initialize()
    {
    	IO_Watchdog_Initialize();
    	IO_EEPROM_Intialize();
    	IO_SPI_Initialize();
    	IO_Digital_Intialize();
    	IO_Analog_Initialize();
    	IO_PWM_Initialize();
    	IO_UART_Initialize();
    	IO_SMbus_initialize();
    }


    When I step into the IO_Analog_Initiliaze();, the code looks as the following, and I can step over all the functions, without the error appearing.

    #include <stdint.h>
    #include <stdbool.h>
    #include "inc/hw_memmap.h"
    #include "driverlib/rom_map.h"
    #include "driverlib/sysctl.h"
    #include "driverlib/gpio.h"
    #include "driverlib/adc.h"
    #include "driverlib/interrupt.h"
    #include "driverlib/timer.h"
    #include "inc/hw_ints.h"
    
    #include "include/Event.h"
    #include "include/IO.h"
    
    #define ADC_RESOLUTION (double) 0xFFF
    #define ADC_VOLTAGEMAX (double) 3.3
    #define ADC_VOLTAGEMIN (double) 0
    
    IOAnalogChannelCollection IO_Analog_Channels;
    Event IO_Analog_ScanComplete;
    
    static bool _initialScanPerformed = false;
    static uint32_t IOAnalogBuffer[sizeof(IOAnalogChannelCollection) / sizeof(IOAnalogChannel)];
    
    void IO_Analog_Initialize(void)
    {
    	Event_InitializeEvent(&IO_Analog_ScanComplete, "AnalogComplete");
    	IO_Util_EnablePeripheral(SYSCTL_PERIPH_ADC0);
    
    	memset(&IOAnalogBuffer[0], 0, sizeof(IOAnalogChannelCollection));
    
    	MAP_ADCReferenceSet(ADC0_BASE, ADC_REF_INT);
    	MAP_ADCHardwareOversampleConfigure(ADC0_BASE, 4); 
    
    	uint8_t sequencer = 0;
    	uint32_t index = 0;
    	
    	MAP_ADCSequenceDisable(ADC0_BASE, sequencer);
    	MAP_ADCSequenceConfigure(ADC0_BASE, sequencer, ADC_TRIGGER_PROCESSOR, 3);
    	MAP_ADCSequenceStepConfigure(ADC0_BASE, sequencer, index++, IO_Analog_Channels.Spare0.ADCInputChannel);
    	MAP_ADCSequenceStepConfigure(ADC0_BASE, sequencer, index++, IO_Analog_Channels.PDU_24V.ADCInputChannel);
    	MAP_ADCSequenceStepConfigure(ADC0_BASE, sequencer, index++, IO_Analog_Channels.PDU_12V.ADCInputChannel);
    	MAP_ADCSequenceStepConfigure(ADC0_BASE, sequencer, index++, IO_Analog_Channels.PDU_5V.ADCInputChannel);
    	MAP_ADCSequenceStepConfigure(ADC0_BASE, sequencer, index++, IO_Analog_Channels.PDU_4V5.ADCInputChannel);
    	MAP_ADCSequenceStepConfigure(ADC0_BASE, sequencer, index++, IO_Analog_Channels.PDU_3V3.ADCInputChannel);
    	MAP_ADCSequenceStepConfigure(ADC0_BASE, sequencer, index++, IO_Analog_Channels.Force.ADCInputChannel);
    	MAP_ADCSequenceStepConfigure(ADC0_BASE, sequencer, index++, IO_Analog_Channels.PullForce.ADCInputChannel| ADC_CTL_IE | ADC_CTL_END);
    
    	sequencer = 0;
    	MAP_ADCSequenceEnable(ADC0_BASE, sequencer);
    	ADCIntRegister(ADC0_BASE, sequencer, ADC0_Seq0Handler);
    	MAP_ADCIntEnable(ADC0_BASE, sequencer);
    	IntPrioritySet(INT_ADC0SS0,0);
    
    	//Make sure an initial scan has been performed
    	IO_Analog_BeginScan();
    
    	while(!_initialScanPerformed)
    		IO_Util_BlockForMs(1);
    
        	MAP_SysCtlPeripheralEnable(SYSCTL_PERIPH_ADC1);
    
        	MAP_ADCHardwareOversampleConfigure(ADC1_BASE, 16);
        	MAP_ADCSequenceConfigure(ADC1_BASE, 3, ADC_TRIGGER_PROCESSOR, 0);
        	MAP_ADCSequenceStepConfigure(ADC1_BASE, 3, 0, ADC_CTL_CH19 | ADC_CTL_END | ADC_CTL_IE | ADC_CTL_SHOLD_256);
        	MAP_ADCSequenceEnable(ADC1_BASE, 3);
       
        	ADCIntRegister(ADC1_BASE, 3, TouchScreenIntHandler);
        	IntPrioritySet(INT_ADC1SS3,IO_InterruptPriority);
    
        	MAP_ADCIntEnable(ADC1_BASE, 3);
        	MAP_IntEnable(INT_ADC1SS3);
    }
    
    void IO_Analog_BeginScan()
    {
    	MAP_ADCSequenceConfigure(ADC0_BASE, 0, ADC_TRIGGER_PROCESSOR, 3);
    	MAP_ADCProcessorTrigger(ADC0_BASE, 0);
    }
    

    The error is as well also not appearing if I am just "running" the code.
    What can be the issue?

  • Additionally, I can provide you with some fresh data from todays testing. When using the XDS100V3 with our developed board, I can step in the code until the same point, but if I run the code, I get a new error, which I do not get on the TIVA (eval kit):

    CORTEX_M4_0: Can't Run Target CPU: (Error -2134 @ 0x0) Unable to control device execution state. Reset the device, and retry the operation. If error persists, confirm configuration, power-cycle the board, and/or try more reliable JTAG settings (e.g. lower TCLK). (Emulation package 7.0.48.0)

    I am attaching my schematic here over the JTAG interface on the developed board:


    I have read various topics about the JTAG interface - some say that TCK should be pulled down, others say it is just as good to pull it high. Can this be the issue? Or is there some other explanation to why I get the additional error -2134 on the developed board? (in comparison to not getting it on the TIVA, with same setup)

  • carlsen81 said:
    When I am stepping over the functions, the error appears when stepping over "IO_Analog_Initialize();"

    Do note the following: (extracted from your code - those 2 function calls noted - are 5 calls apart):

    • MAP_ADCHardwareOversampleConfigure(ADC0_BASE, 4);
    • MAP_ADCSequenceStepConfigure(ADC0_BASE, sequencer, index++, ...

    Concerns are these:

    • Might MAP_ADCSequenceStepConfigure() become 'confounded' by the use of 'index++'? (especially if the MCU's 'ROM version' of that function is employed!)
    • Vendor's Charles provided a terrific, in-depth, recent review of, 'ADC Hardware Oversampling'. (again - the use of 'index++' especially when HW Oversampling is deployed - appears 'risky.')

    My 'caution' may be misplaced ... your 'replacing' any/all occurrences of  'index++'  with (boring) hard-coded values - appears a 'quick/easy' means to  'test that caution/concern'...    

    In general - I'm 'all for'  use of such clever, adaptive, & expansive functional  'add-ons'  ...  provided that they,  'Do NO Harm!'      And that (harm) - or freedom from such - has (yet) to be (positively) determined...

    The in-depth examination of, 'ADC Hardware Oversampling' appears here:    (a (very) full cup of coffee ... and/or other (legal) stimulant - may be required...)

    https://e2e.ti.com/support/microcontrollers/tiva_arm/f/908/p/712037/2643942?tisearch=e2e-sitesearch&keymatch=ADC%20Hardware%20Oversampling#2643942

  • Hello Carlsen,

    Our TM4C JTAG guide directs the exact connections you should have, and that should be the only reference for the correct JTAG interface connections with our device: www.ti.com/.../spma075.pdf

    TCK should be pulled up for the ARM 20-Pin connector.

    Have you tried running some TivaWare examples and attempted to step through code in the same way? I'd be curious if the issue could be repeated that way.

    Let us know on the results of trying what cb1 suggested.
  • Dear cb1,

    Thank you for the reply! I have tried to remove the parts that you are mentioning in the following order:

    1) Comment out the Oversampling function call, to avoid using it --> no change in the error 1170 message when stepping over
    2) Change the index++ to hardcoded values, along with the 1) --> no change in the error 1170 message when stepping over
    3) Do 2) without 1) --> no change in the error 1170 message when stepping over

    Reverted back, since no change was seen on the various points that you mentioned. 

    :

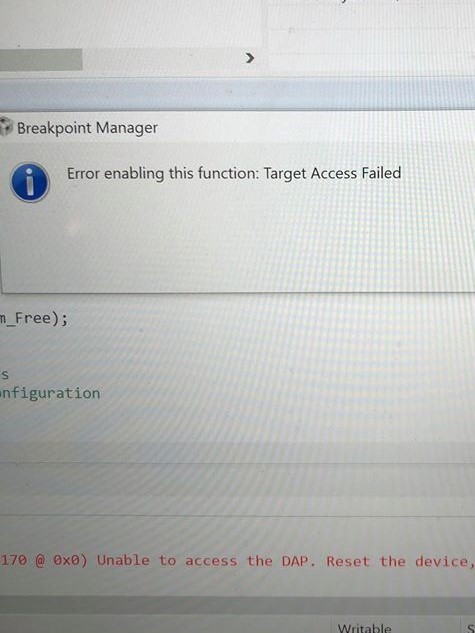
    I did change the setup on the developed board to the one that is found in your application guide, but the same error happened again when trying to run the code with the debugger on the system. That is a crucial thing that I have to fix, since I am not able to 1) run the code on the HW with the debugger, and 2) insert breakpoints on the developed HW with the debugger. It simple loses the target when a breakpoint is inserted...

    Sorry the picture quality, I went for the quick'n'dirty "screenshot".

    Any suggestions are still very much appreciated!! 

  • Hello Carlsen,

    Looking into the errors some more, I was pointed to the following: software-dl.ti.com/.../ccs_debugging_jtag_connectivity_issues.html

    It sounds like the issue isn't hardware based, but an issue with software.

    Later today I will try and do a deep dive review of the code you posted earlier to see if anything escaped my eye the first time.
  • Dear Jacobi,

    Thank you for looking into the website that you provided. I do however struggle to find any useful information from the link itself, and maybe you can help me understand what the following means:
    1) but there is a possibility the running firmware on the device may be preventing the JTAG debugger from properly connecting (if the device has flash memory)
    2) In these cases, consult the documentation of your device to find out how to unlock it.

    Is my device locked in some way?
    Thank you for your time, once again.
  • Hello Carlsen,

    If the device was locked you wouldn't be able to debug after the error occurred. If that ever happens, you can use LMFlash Programmer to unlokc the device. The larger point at hand here is that the error can occur due to firmware so something about your firmware is impacting JTAG.
  • Dear Jacobi.
    I see your point now.
    Earlier today I tried something in the lab, that I would like to share with you as well - that might confuse even further the case of the issue.
    According to the application note of the TM4C1294XL, the ICDI was configured to be a debugging OUT port, and was used to program our developed board, and debug, as the XDS100V3 previously was.

    When using the ICDI as debugger for our developed board, the program executes normally, can do a run operation, can set breakpoints and step over at the exact point (Analog initialization), where the XDS100V3 elsewhere would halt.
    Anybody feeling confused? I am the least.

    For our application we still prefer the XDS100V3, so I am still looking for a solution to our presented problem.

    Best regards, and have a good weekend on this one.
  • Hi Carlsen,

    You are right, that does further confuse... the plot certainly thickens... I am going to see if I can speak with a CCS/debugger expert on Monday and try to get some further ideas on what could be going on wrong.

    Want to try and summarize a few points on behavior:

    1) If stepping over IO_Analog_Initialize, the Error -1170 DAP access lost occurs
    2) If using custom board w/ XDS100v3, you can single step to IO_Analog_Initialize, and then trying to run from this point, you get "Can't Run Target CPU: (Error -2134 @ 0x0)"
    2a) If you just free run instead of single step to IO_Analog_Initialize, you don't have an error, correct?
    3) Breakpoints do not work beyond IO_Analog_Initialize? Or is it just within the function that they don't work?
    3a) Was breakpoint operation tested on the LaunchPad as well?
    4) The ICDI does not exhibit any of these behaviors

    Let me know if I captured anything incorrectly.

    Lastly for when I speak with my CCS contact, what CCS version are you using?
  • Dear Jacobi,

    Thank you for your time, I have updated your list below - it was almost correct but with small modifications it appears as my experience in the lab:

    1) If stepping over IO_Analog_Initialize, the Error -1170 DAP access lost occurs
    2) If using custom board w/ XDS100v3, you can single step to IO_Analog_Initialize, and then trying to run from this point, you get "Can't Run Target CPU: (Error -2134 @ 0x0)", along with Error -1170 DAP access lost
    2a) If you just free run instead of single step to IO_Analog_Initialize, you don't have an error, correct? If I free run on TM4C1294XL no issue - but on my board I get "Can't Run Target CPU: (Error -2134 @ 0x0)" whenever I free run instantly
    3) Breakpoints do not work beyond IO_Analog_Initialize? Or is it just within the function that they don't work?  They never work on developed board. They work on TM4C1294XL
    3a) Was breakpoint operation tested on the LaunchPad as well? See above.
    4) The ICDI does not exhibit any of these behaviors Correct - everything works on both TM4C1294XL and my developed board when using the ICDI, but I do not like to use a modified TM4C1294XL inside my product.

  • Hello Carlsen,

    Thanks for all of the added details. It is strange to me that some of these issues occur on our LaunchPad with the XDS100v3, but just based of the scope of issues you have on your custom board I wonder if we need to carefully assess the JTAG hardware on it.

    There may still be a software issue that is triggering the problem on both boards but I really don't feel that JTAG is working well given the breadth of issues it has including that you can't free run.

    Have you had any success running any other software on it? Could you try and run something as simple as blinky on the custom board?

    Reviewing the JTAG schematic again vs the ARM 20-pin, I made one observation I missed initially and also want to clarify a couple points

    1) TDI has a pullup but it shouldnt based on our recommend from www.ti.com/.../spma075.pdf
    2) Can you elaborate on what D48-D50 are? I presume protection circuitry?
    3) Does TDO not have a pulldown? If so, then it needs one. Recommend value is 10k.
    4) What is the purpose of the R170 resistor between pins 9 and 11?
  • Dear Jacobi.

    Sorry for the delayed answer, the reason behind the delay is due to another board under development has been finished, with a TM4C123G processor on it. This board was using the exact same JTAG interface schematic as shown in a previous post, just without the mounted TVS diodes. The omit of the TVS diodes prove to remove the errors with breakpoints and free running problems - so far so good. It now seems that debugging is indeed an option, so it gave me the confidence to remove the diodes from the other board (original post). 

    It proved to be the issue on this board as well. Therefore, the only remaining issue is the analog software module that can be reproduced by the evaluation board as well. I have talked to one of our firmware engineers about the issue, and we believe it could be a timing issue apparent by the code and/or RTOS. 

    The diodes were reported to have a stand off voltage of 3.3 V (meaning no significant conduction at 3.3 V) and a minimum breakdown voltage of 4.0 V. I am not sure why they interrupted the JTAG lines under some circumstances (free running + breakpoints) but it appears to be the case that these lines are very sensitive to added diodes / capacitances that might follow by this. The diodes part numbers are: USB50803C. The more weird part is however still, that the inline debugger on the evaluation kit still worked with the diodes attached to the board. Could be that the XDS100V3 is just exceptionally fragile to any added diodes and/or following capacitances, even though this is not proven in any way and rather just my current assumption.

    I have not yet been able to test the voltages since the diodes are removed and now it works wonders. Sorry that I am not able to elaborate on this. 
    Please consider the matter closed and solved.

    Thank you very much for the detailed help.