Hi, Support team
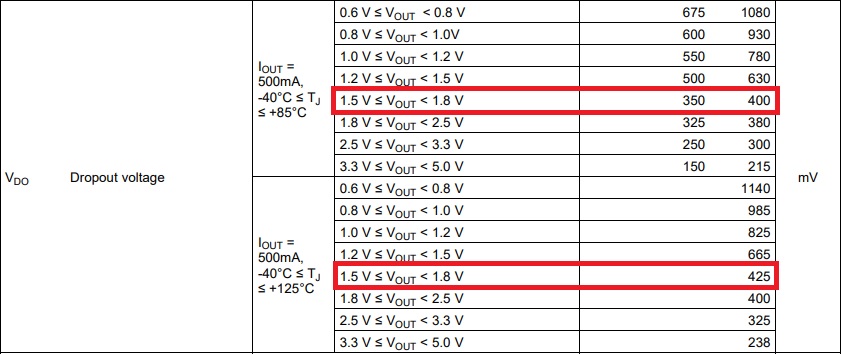
I can see the the characteristic data of Drop Voltage vs Iout in the datasheet as follows.

My customer request the same data of the Drop voltage vs Iout at Vout=1.2V.
Can you provide it to me?
Thanks
Tamio
.
Hi, Support team
I can see the the characteristic data of Drop Voltage vs Iout in the datasheet as follows.
My customer request the same data of the Drop voltage vs Iout at Vout=1.2V.
Can you provide it to me?
Thanks
Tamio
.