


Dear TI
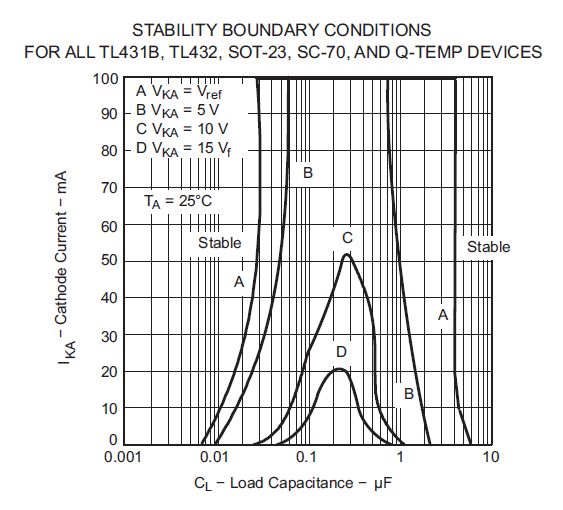
There are two figures of the stability bundary condition chart as figure15 and figure16 on TL431 datasheet.
And aslo there are two figures on application report of "Understanding Satbility Boundary Conditions Charts in TL431,TL432 Datasheet" as figure1 and .
http://www.ti.com/general/docs/lit/getliterature.tsp?baseLiteratureNumber=slva482&fileType=pdf
But Stability chart are different between figure16 of datasheet and figure2 of apps note even if there are same devices.
Below figure is on datasheet.
and below figure is on applicaton reports.

Coud you show me the reason why these are different?
Thank you and best regards
K.Narisawa

