This thread has been locked.

If you have a related question, please click the "Ask a related question" button in the top right corner. The newly created question will be automatically linked to this question.

TL432: Could you tell me about TL432's data?

Part Number: TL432

Hi team.

My customers are considering TL432IPK,

I have be inquired about this device below.

So, can you tell me about this?

Question: How many Vref temperature characteristics are in the from 0 to 70℃ range?

※Because we will treat it as a reference value not adding individual variation,

 I will be helpful if you have the data expanded.

※I'm OK that the temperature data's step may be rough.

※I will be helpful if you can receive up to 3 datas, but it is OK that if you don't have it to receive only 1 data.

Best regards,

masumi Sekiguchi

  • Hi Masumi Sekiguchi,

    We do our testing over the full temperature range. In the case of the TL432I, the temperature range is -40C to 85C so all our VRef characteristic for the TL432I are over that range.

    If you are only interested from 0C to 70C then the TL432C EC table is over that temperature range.
    The VRef characteristics over temperature are on the EC table. If you are looking for graphs then Figure 1 in section 7.14 of the Datasheet has several examples.

    Our VRef Temperature specification "min" and "max" deviation can happen across any temperature range, therefore any graphs we give are just typical because we cannot guarantee a trend.

    -MZ
  • Thank you for contacting.

    If we will consider the worst value, we understand that value is able to cover everything at under the conditions of the datasheet.
    Also, I understand that you must consider its worst value in design, too.
    (We read the data sheet, so I also know the Vref's several examples on.)

    ★However, since My customer want to know to what extent the Vref temperature characteristic is possessed as the capability value of this product (TL 432 I), since typical data can be used,
    I would like you to provide me if there is any actual measurement data.

    Best regards,
    Masumi Sekiguchi.
  • Hi Masumi,

    I currently do not have any measurement data for the TL432I device.
    Just to double check. Do you want Vref vs Temp (0C to 70C) on the TL432I? I can go into the lab and provide measurement data taken on the bench but it might take a week or more. Would that help your customer?

    -MZ
  • Thank you for your comments.

    >Do you want Vref vs Temp (0C to 70C) on the TL432I?
    Yes, I want that data so please measure the data.
    (We will treat it as reference data only.)

    >I can go into the lab and provide measurement data taken on the bench but it might take a week or more.
    If it is around about a week, please measure.
    (Please correspond within two weeks.)

    >Would that help your customer?
    Yes, that help my customer.

    Best regards,
    Masumi Sekiguchi.
  • Hi Masumi

    Here is an example typical data from 1 TL432I. I tested the full temperature range with a key focus on the 0-70C.

    Temperature (C) Vk=Vref (V)
    -40
    2.482
    0
    2.4926
    15
    2.4941
    25
    2.4957
    50
    2.4986
    60
    2.4997
    70
    2.5004
    85
    2.5013
    125
    2.5024

    -MZ

  • Thank you for measuring.

    There is a point in unknown, so please teach me.

    In the example of Vref data described in the data sheet,
    It has the mountain type characteristic(it lowers somewhat at low temperature and high temperature),
    but the acquired data has characteristics to fall only at low temperature.

    Is this good as thought to be the individual value of the IC that confirmed the data?
    ※ Are you affected by the resistance etc. connected to theperiphery?

    If it is an individual value, I will reply to the customer as it is.

    Best regards,

    Masumi Sekiguchi.

  • Hi Masumi,

    The Temp Co is a guaranteed limit but doesn't say anything about slope or shape. An example of this is figure 1 in section 7.14 of the datasheet. All 3 lines are within spec but different shapes. A good document on this is the following: http://www.ti.com.cn/cn/lit/an/slyt183/slyt183.pdf. It goes more in detail over the temp Co and what it stands for.

    When doing these measurements, the only the device was heated up so there was minimal change due to external components.

    -MZ

  • Thank you very much for the answer.

    Is it possible to tell the measurement circuit diagram measured the other day?
    (It's OK as possible!)

    Best regards.

  • Hi Masumi,

    It was just figure 20 on the Datasheet at 10mA. I used 250Ohms at 5V.

    -MZ
  • Thank you for the answer.
    I'm sorry, but I late contact.

    By the way, I needed to the number of quantitys by 2 more.
    Q: Can you measure them?
    ※If it is impossible I'll consider other methods.

    Best regards,
    Masumi Sekiguchi
  • Hi Masumi,

    I can try, but it might be a few or so before I can get to it.

    -MZ

  • Hi.

    Thank you for your response the other day.

    Based on you taught, I also measured it.

    (We measured 10 pices for the purpose of increasing the quantity.)

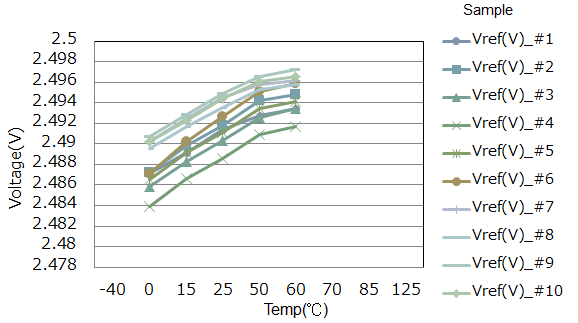
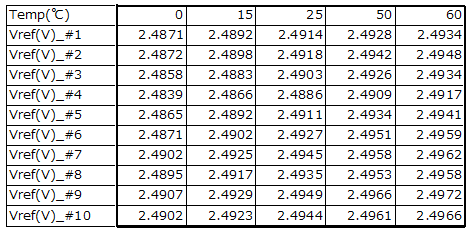
    Due to the equipment possessed by our company, the temperature range has been only 0~60 ° C, but the data is as below.

    Do you think that this data is also appropriate from the following viewpoint?

    · Individual variations of 10 individuals

    · One temperature gradient

    Please tell me.

  • Hi Masumi,

    I was on travel and I didn't get a chance to get to the lab.

    Your data looks good and everything seems to be within spec by a good margin and they have the same correlation. Very close to my data.

    -MZ