This thread has been locked.

If you have a related question, please click the "Ask a related question" button in the top right corner. The newly created question will be automatically linked to this question.

CCS/TMDSOSKL137: <<<TDM Mode(I2S Mode) data,,,>>> How to convert TDM Mode(I2S Mode) data to "Waveform data"??

Part Number: TMDSOSKL137

Tool/software: Code Composer Studio

Hello, 

I'm again.....^^

I'm experiment audio test code.. in            "EVMOMAPL137 Test Code" 


~\EVMOMAPL137 Software Resources\EVMOMAPL147 test code\RevD_EVMOMAPL137_BSL\evmc6747_v1\dsp\tests\aic3106

in test code ,

Final Read and Write code is 

and the graph is 

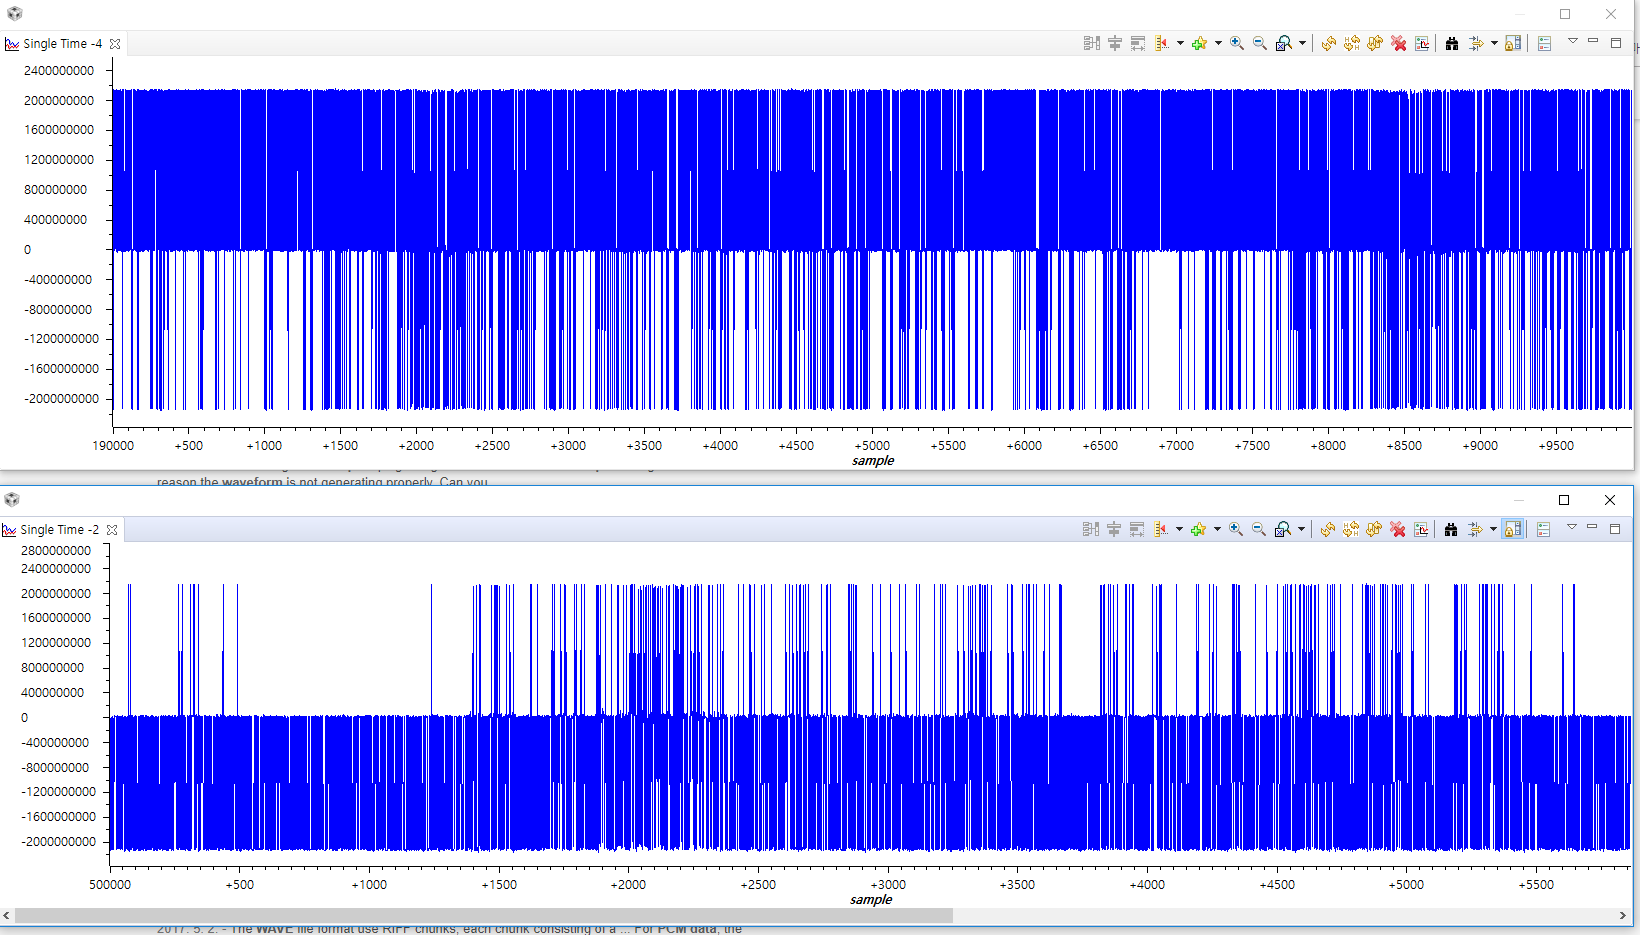
1. Left_Right channel data

2.Left_Right channel data_Zoomin(maximum surrounding)

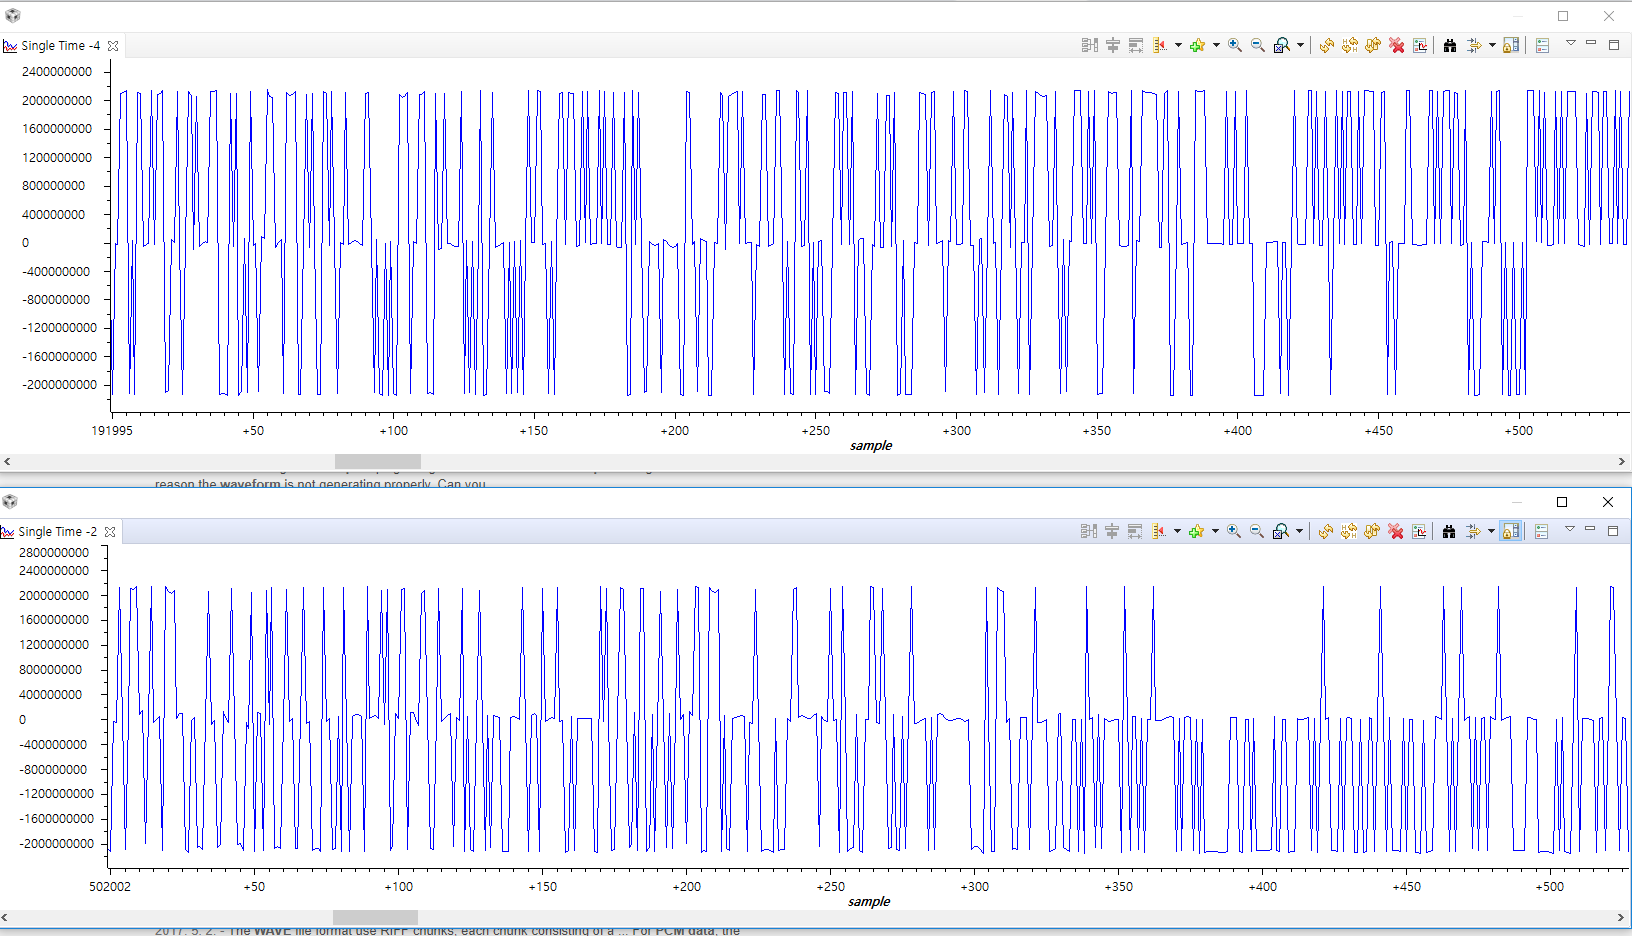
3.Left_Right channel data_Zoomin(500sample)

I just want waveform data...

How to convert TDM Mode(I2S Mode) data  to "Waveform data"??

  • The BSL library is SW provided by board manufacturer and not provided by TI so we are not currently supporting this baseline on the TI E2E forums.
    If you need support for MCASP and audio related issues, we recommend that you use the Processor SDK RTOS baseline for this device.

    Please understand that the digitized data coming from the AIC codec is not just a analog signal sampled at different time intervals but two channel audio data or an analog audio signal converted to left and right channel sample data interleaved together. You will need to de-interleave the data and then plot it. Ti understand how the data is received, you can generate a sine signal on the PC using a tool like Audacity and save the signal to a .wav or mp3 file and play it on the host and connect the input to the Line in of the input MCASP serializer, then figure out how to extract the samples to get a sine wave output.


    Regards,
    Rahul
  • Yeah,, You are right... I understood.

    Anyway, Is it possible convert TDM Mode(I2S Mode) data to "Audio Waveform data" in REAL-TIME(ONLINE)??


    Regards,
  • Is there a reason you want to plot the TDM data in real time? As long as you de-interleave the left and the right channel correctly in the receieved I2S format, you should be able to plot the left and the right channel data to view visually. I am not sure if CCS Graph tool is the best one for it though as it can only show you the current windows data and wont keep updating when the DSP is free running.

    Generally if you had a host like an ARM connected, you could use high level OS On the ARM and read the data in realtime from memory using graphics interface like QT as you can see from this demo :
    www.youtube.com/watch

    Regards,
    Rahul