This thread has been locked.

If you have a related question, please click the "Ask a related question" button in the top right corner. The newly created question will be automatically linked to this question.

DRV5053: sensitivity variation

Part Number: DRV5053

dear Sir,

I would have more details on sensitivity variation for DRV5053OA.

I found fig.4 in datasheet for temp variation but figure scale is not very accurate.

=> Would it be possible to get same figure for OA version only and wide scale ?

Sensitivity accuracy looks pretty flat over temp.

=> does this trend applicable to all lots in production? I mean despite process variation, does variation due to temp almost flat for every chip in prod ?

=> What is the sensitivity variation due to temperature change only ? i mean how much sensivity deviate over the operating temp range (not including process deviation) ?

thanks in advance for your reply.


kind regards,

Paul

  • Hi Paul,

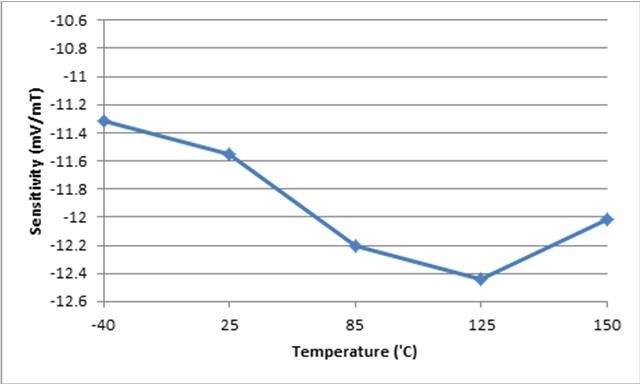
    => Would it be possible to get same figure for OA version only and wide scale?

    => does this trend applicable to all lots in production? I mean despite process variation, does variation due to temp almost flat for every chip in prod?

    This plot represents the sensitivity vs. temp variation of the typical unit. So yes, in a statistical sense this trend is applicable to all lots in production. However, a particular unit you test may show bigger or smaller (percentage) changes in sensitivity for the same temp deltas.

    => What is the sensitivity variation due to temperature change only? i mean how much sensivity deviate over the operating temp range (not including process deviation)?

    Unfortunately, the temp drift of sensitivity on this product has not been characterized and we don't measure this parameter in production. According to the above plot the typical sensitivity drift can be about 10% peak-to-peak across temp extremes.

    Best Regards,

    Harsha