This thread has been locked.

If you have a related question, please click the "Ask a related question" button in the top right corner. The newly created question will be automatically linked to this question.

IWR1642BOOST: Detecting objects at different distances

Part Number: IWR1642BOOST
Other Parts Discussed in Thread: IWR1443BOOST, IWR1443

Hello!

I've read about experiments with mmWave sensor here: Measuring Object Height with mmWave Radar

I don't understand experiment result with adult on x-y plot. I expected to see one point for ground and one for adult. Why there are 4 points on x-y plot?

Thank you

  • Hello Arsenii,

    Thanks for the interest in TI mmWave Sensors. As mentioned in the experiment, the mmwave EVM was mounted at the garage door entrance, vertically above the Human target. The azimuth field of view of the antenna on the IWR1443BOOST EVM is about 110 degrees which is much wider than what the head of a human can cover at that range. Because of the wide FOV, we see reflections from other parts of the human target which are seen as the extra points you see on the plot.

    The FOV is dependent on antenna design. You can also use a lens to focus the beam.

    Regards

    -Nitin

  • Thank you for reply. 

    And why there are only 3 points for adult? And one more thing: there is only one point for mazda 3 on x-y plot, but 2 points are marked on range profile. And there are 2 points for honda civic si on x-y plot, but 1 point is marked on range profile. Why?

  • Hello Arsenii,

    The Sensor gets multiple reflections from the object. The OOB demo has peak grouping option which was enabled for this experiment. Peak grouping selects and reports only the strongest of the neighboring detected points. The OOB demo supports peak grouping in both range and Doppler dimensions and you can enable/disable either one or both of them using check boxes on the mmWave Demo Visualizer configure tab. You'll see many more points if you disable peak grouping.

    I would also like to clarify the markings shown on the plots in the experiment. Based on the configured CFAR threshold, the detected peaks are marked on the visualizer using orange dots on the range profile plot. For the Honda Civic, there are actually 2 orange dots on the range profile plot, corresponding to the two points on the XY Scatter plot. The red circles are not part of the visualizer display but something we put on the image to match points in the range profile and scatter plots.

    Regards
    -Nitin

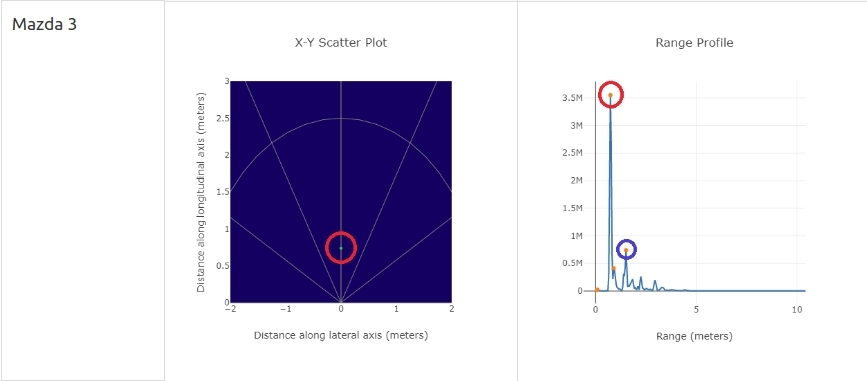
  • Screenshot from mazda 3 results:


    I see 1 point with red circle on x-y plot and 4 points on range profile, one with red circle, one with blue circle and two without circles. Why?

  • Arsenii,

    The peaks which have orange dots are the ones which the CFAR detection algorithm marked as detections based on the configured threshold value. The mmWave Training Series on ti.com has excellent resources where you can get more information on the CFAR detection scheme. Specifically, the mmWave Sensor 1443 Hardware Accelerator training video contains overview of CFAR detector path in the IWR1443 hardware accelerator.

    I believe the blue dots are adding some confusion in the plots. As I mentioned before, the red (and blue) circles are basically annotations which were added to the plot snapshots to match the corresponding points on the range profile and scatter plots. Similarly, the blue circles also show other strong reflections from the object but it appears that they create confusion so we'll take an action to remove them from the snapshots. Thanks for your feedback.

    The peaks which do not have orange dots on them were not marked as detections by the CFAR algorithm based on the configured threshold.

    Regards

    -Nitin

  • Arsenii,

    In case you don't have any more questions on this topic, can you please close this ticket?

    Thanks
    -Nitin