This thread has been locked.

If you have a related question, please click the "Ask a related question" button in the top right corner. The newly created question will be automatically linked to this question.

TDC1000: What wrong with TOF in ultra sonic flow meter application?!!

Part Number: TDC1000

Dear my TI staff,
We are currently developing a system that ultra sonic flow meter.
I ask you two questions during the development process.

1. For a long period of time,  As the result of the measurement of TOF values of
 the DOWN STREAM STREAM and UP STREAM STREAM
 Contrary to expectations, we could see that Tup and Tun were looking farther away.
 As shown picture 1 with attached.
 This will cause the flow rate to fall. What's wrong with you
 Please advise.

  picture 1. TOF of Tdn and Tup

2. When the flow rate stops at the ZERO point,  the Tup and Tdn was shook and repeated too.
  What is the reason?

Thanks!!

  • Hello,

    Could you please share some details about your setup and these plots? What are the units for the axes? Could you include the device configuration that you are using to generate these?

    I'm a little unsure of what is going on physically in this setup. Since the TOF is decreasing for both the upstream and downstream measurements it seems like temperature may be affecting the speed of sound in your fluid. The fact that the upstream and downstream measurements are diverging from each other means that the flow rate must be increasing. Is there any way for you to monitor the flow rate outside of the TDC1000 so that you have a baseline to compare the TDC1000's measurements to? From this it really just seems like the flow rate is actually increasing.

    In the second plot, are you showing the delta TOF? and again what are the units for the axes?

    Regards,
  • To dear Scott Cummins.
    And thank you, rear it.
    Of course, data can be shared.
    Attached is the TOF file shown below.
    The contents of the file are measured by Tup(UP Stream) and Tdn(DOWN STREAM).
    Again, the flow rate for the first question is Measured data at a constant flow rate of 20 m^3/h.
    There are other measurement data, but measurements are measured with the same result.
    Even though I thought about the effects of temperature, Tup or Tdn changed.
    According to the changing temperature
    I think the graph must to be parallel.
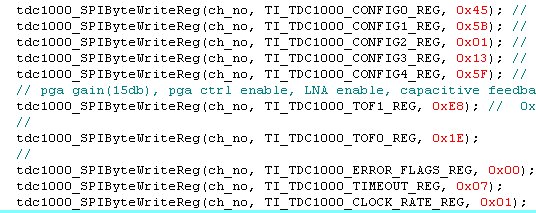
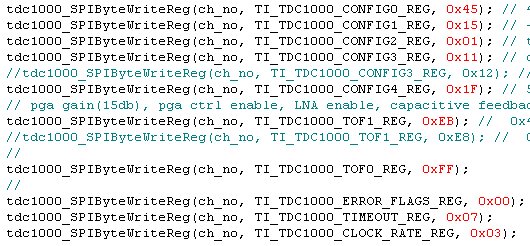
    Additionally, TDC1000 set value.

    TOF_value.xlsx

    Picture#1. CONFIGURE #1

    Picture#2. CONFIGURE #2

    Thank you for your attention!!