This thread has been locked.

If you have a related question, please click the "Ask a related question" button in the top right corner. The newly created question will be automatically linked to this question.

AWR1443: About UnwrappedPhase and outPhase in vital signs demo data

Part Number: AWR1443
Other Parts Discussed in Thread: IWR1443BOOST

Hello,

I am working with vital signs demo using AWR1443BOOST. I parsed saved data with provided MATLAB code.But I have some questions about results.

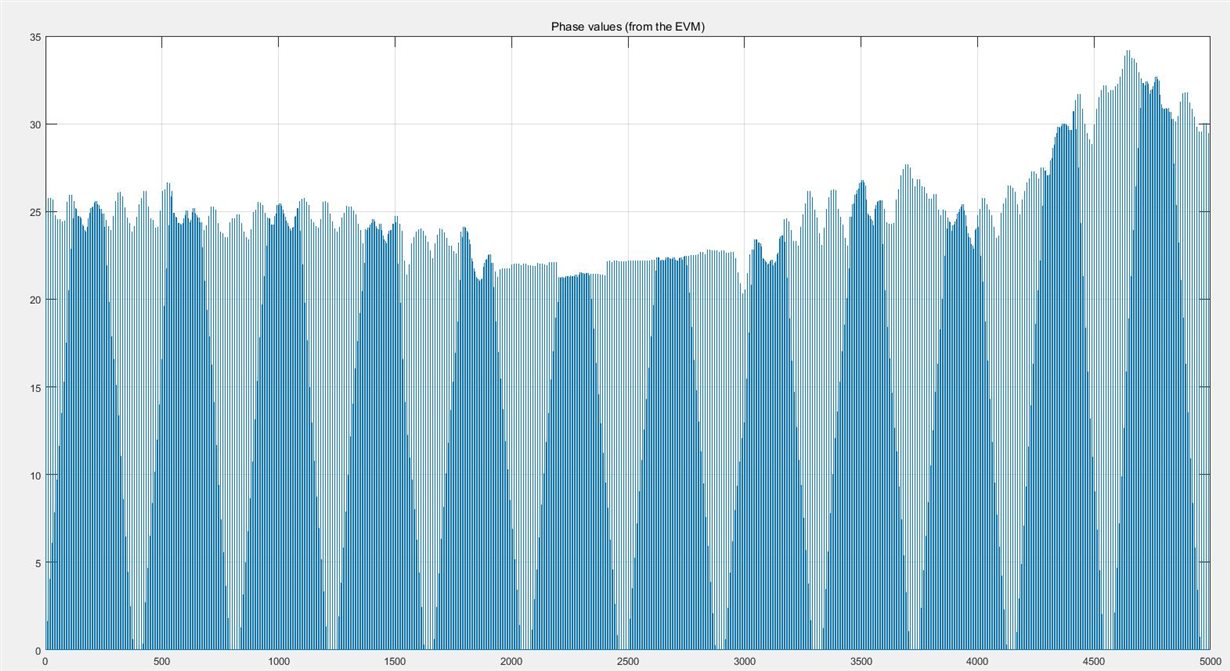
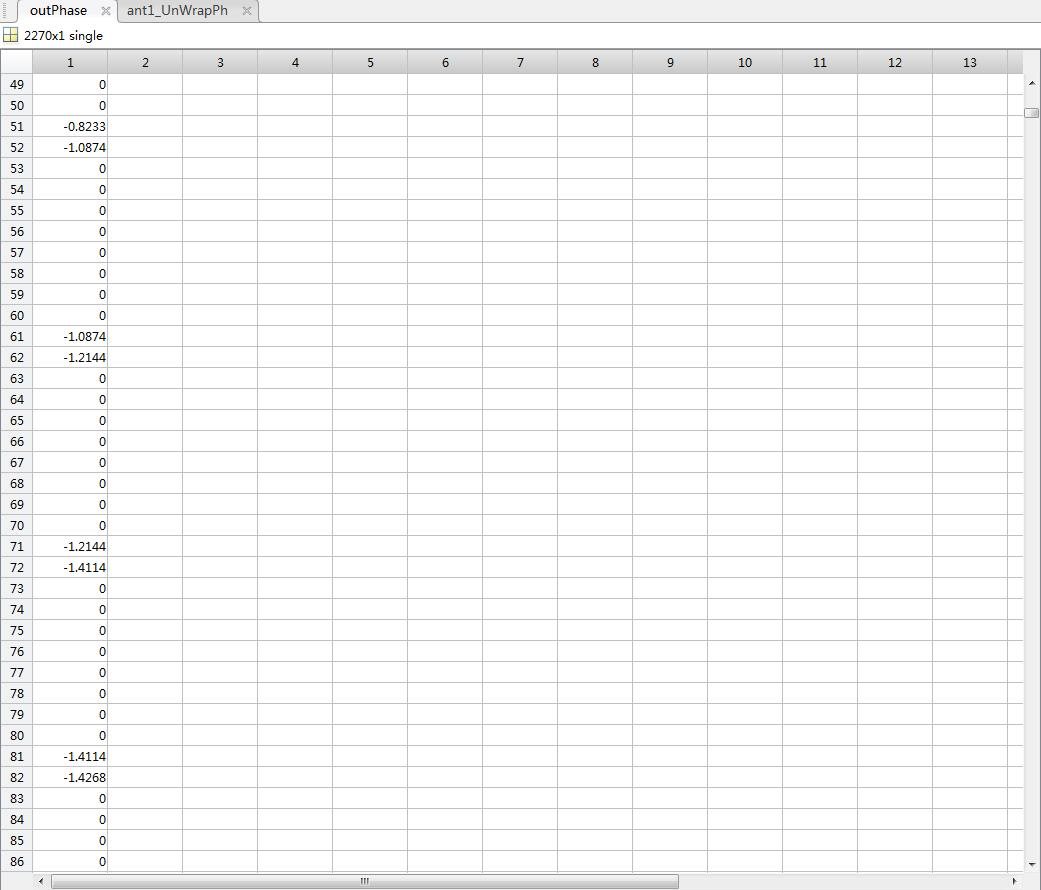
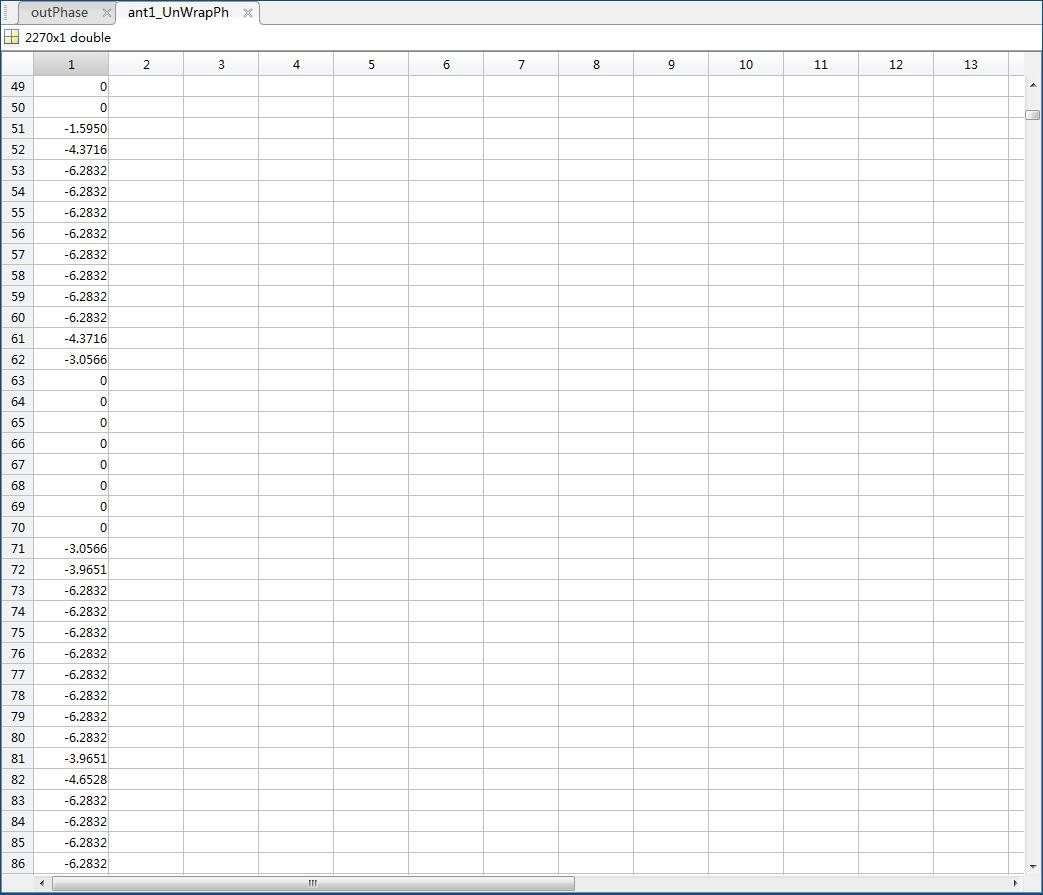
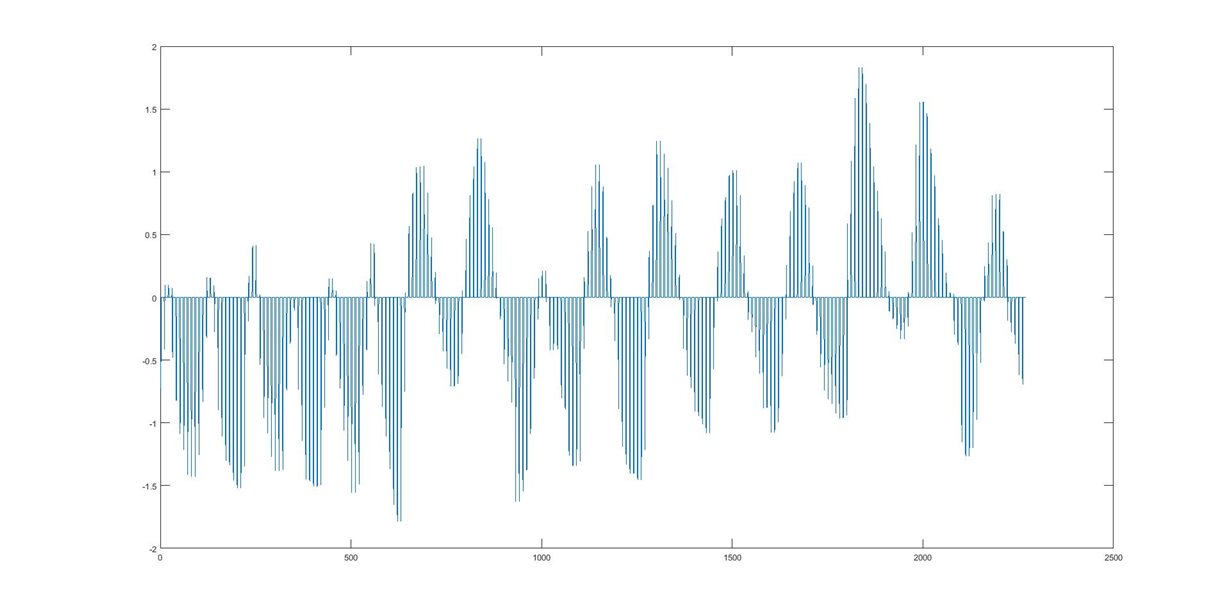
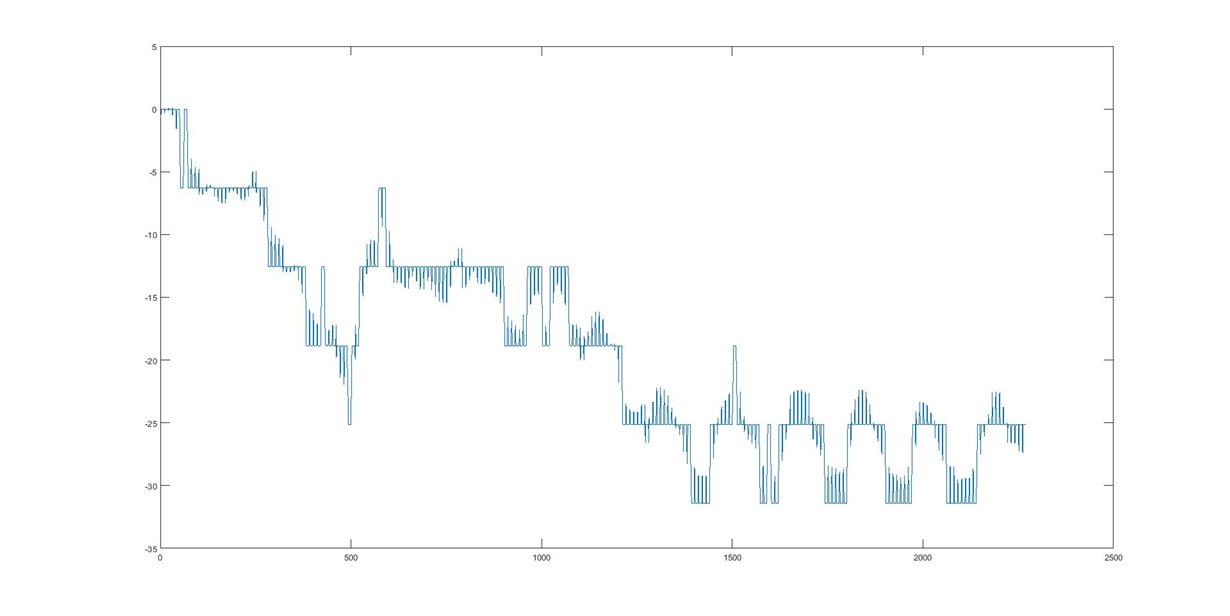
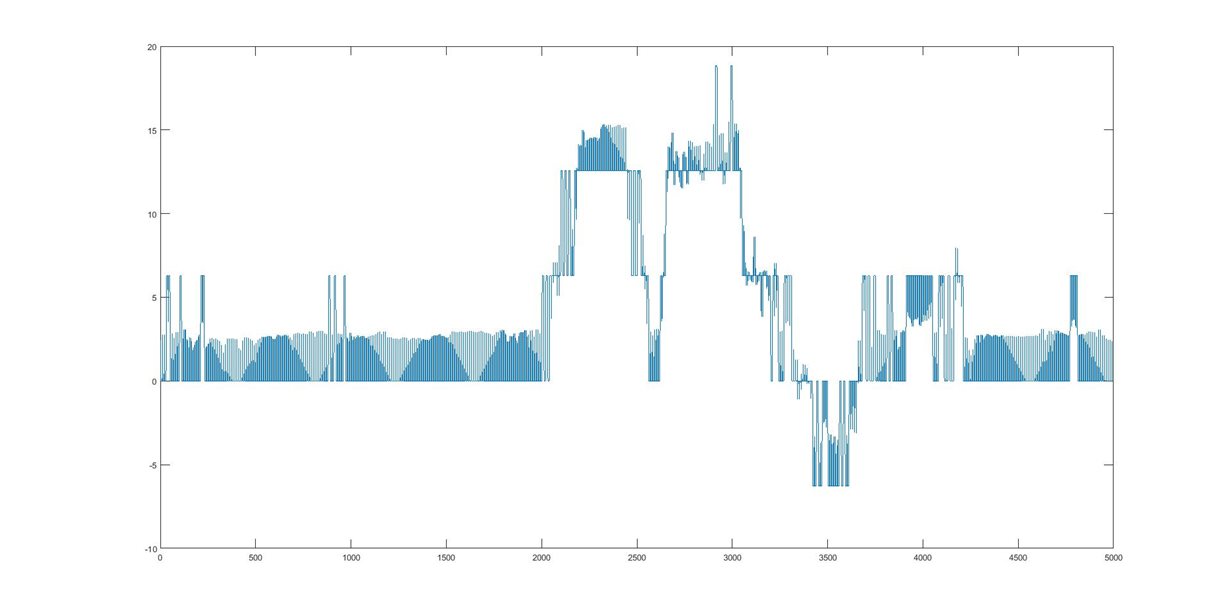
The firtst figure shows the plot of variable called ant1_UnWrapPh,which is the phase of a selected rangeRangeBin.The secound figure shows the plot of variable called outPhase,which represents  the displacement  of human chest in mm. I think thay  have a linear relationship according to DevelopersGuide(the third figure).But their plots look different.Why?Did I miss some steps to trans them?

Thanks.

  • Ray,

    It looks like you need to zoom in on your MATLAB plots.

    Regards,
    Kyle
  • Hi,Kyle,

    Thanks for your reply,but I don't think zoom in on my MATLAB plots helps.To illustrate the problem more clearly,I attached  some figures about the data.

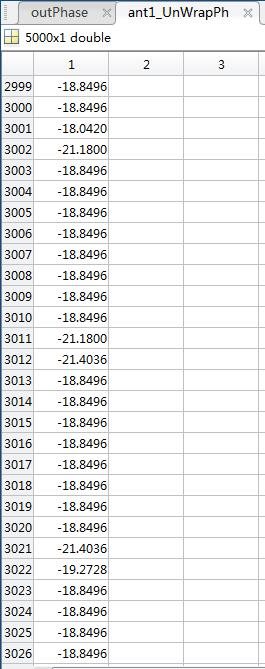
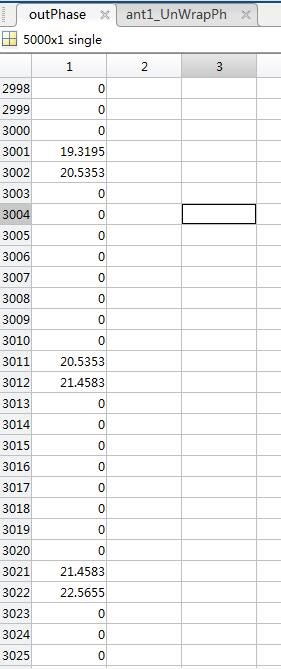
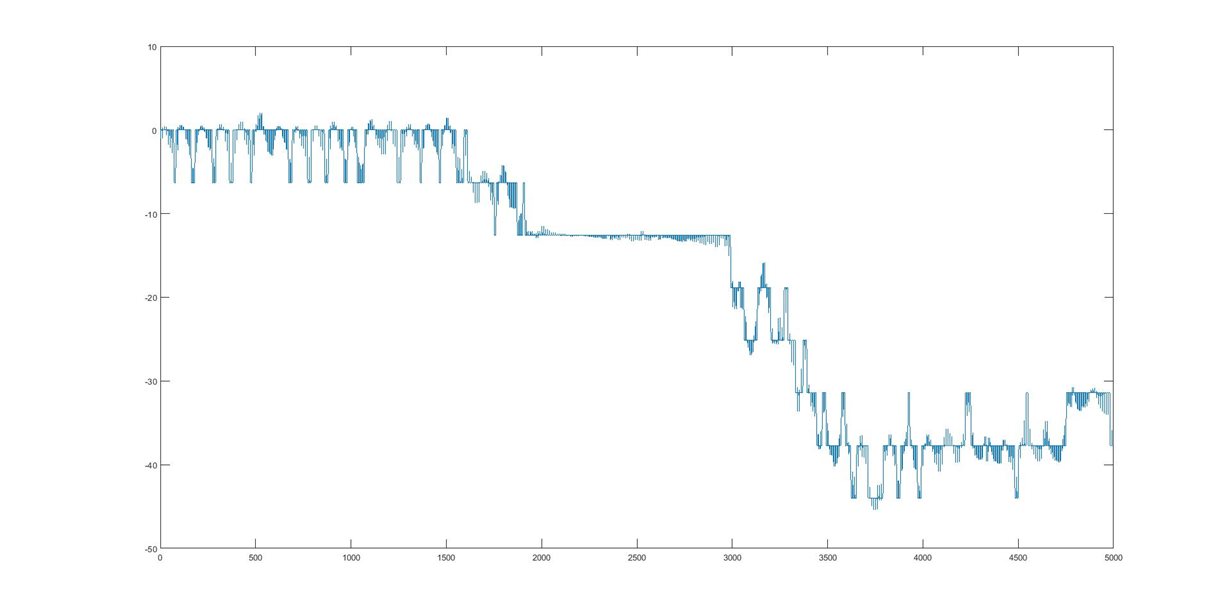
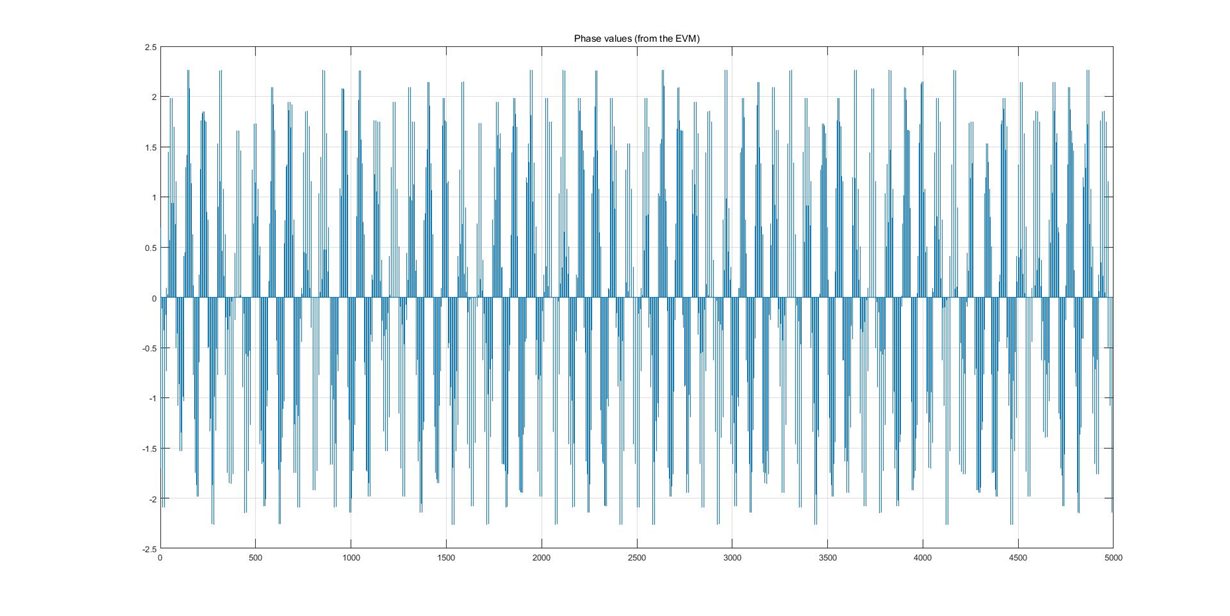
    As you can see,the variables outPhase and ant1_UnWrapPh are so different and don't have a liner relationship.I think I missed some steps to trans ant1_UnWrapPh(phase) to outPhase(displacements in mm),what's that?

  • Plus,I attached a full screen plot about ant1_UnWrapPh.

  • Ray,

    I spoke with one of our systems experts who worked on the development of this lab.

    Looking more closely at the plots, the phase values do not look correct at all. There are many successive phase values int he variable "ant1_UnWrapPh" that have exactly the same values which is not expected.

    What is your measurement setup and how are you saving the data? Does your saved data look exactly the same as the data shown in the GUI?

    Regards,
    Kyle
  • Hi,Kyle

    Thanks for your reply !

    I did more experiments and the results did not improve,here are some results.

    The variable outPhase and ant1_UnWrapPh:

    The plots of outPhase and ant1_UnWrapPh:

    I download a file called 'mmwave_industrial_toolbox_2_5_2' and fellow  steps in mmwave_industrial_toolbox_2_5_2\labs\lab0002-vital-signs\docs\vitalSignsLab_xwr1443_QuickStartGuide.pdf. 

    • First I flashed lab binaries called 'xwr12xx_xwr14xx_radarss.bin'and 'xwr14xx_vitalSigns_lab_mss.bin'.
    • Then removed jumper SOP2.
    • Finally  I execute the Demo GUI in the 'lab0002_vital_signs_gui 'file.
    • I checked Save Data button and a data file was created automaticly,that's the data I used.(The Configuration File I used is profile_2d_VitalSigns_20fps.cfg and I didn't change it at all.)
    • In 'mmwave_automotive_toolbox_2_4_2',I found a example matlab Scripts called main_readGUISavedBinary.m,I use it to parse the data and get the results above.

    1、I think the problem may exist on step unwrap.In matlab script , use 

    ant1_Ph = angle(rangeProfile_cplx(row_index,:));
    ant1_UnWrapPh = unwrap(ant1_Ph);

    to get unwraped phase.Is it correct to unwrap all the phase at the same time since there are only two chrips in a frame?

    2、Does it matters I follow the vitalSignsLab_xwr1443_QuickStartGuide since it said this lab should use IWR1443BOOST?

    3、Does variable outPhase represents the displacements relative to the first measurement (the time I click the refresh button)?

    I really need your help.Thank you!

  • Sorry to forget to answer your question.
    The wave of outPhase looks like the same as the data shown in the GUI but ant1_UnWrapPh doesn't.
  • Ray,

    You can do some additional testing by enabling the test tone that is built into the Vital Signs lab. In dss_data_path.c, look for the following segment of code:

    #ifdef TEST_TONE // Generates a Test-Tone

    float testTone_ampBreath_mm = 1.0;
    float testTone_freqBreath_Hz = 0.45;
    float testTone_ampHeart_mm = 0.01;
    float testTone_freqHeart_Hz = 1.8;

    obj->unwrapPhasePeak = (4 * PI_/WAVELENGTH_MM) *(
    (testTone_ampBreath_mm * sin(2*PI_*testTone_freqBreath_Hz* gFrameCount/obj->samplingFreq_Hz))+
    (testTone_ampHeart_mm * sin(2*PI_*testTone_freqHeart_Hz*gFrameCount/obj->samplingFreq_Hz))
    );
    // +0.5*(testTone_ampBreath_mm *sin(2*PI_*(2*testTone_freqBreath_Hz)* gFrameCount/obj->samplingFreq_Hz)); // Harmonic signal
    #endif

    Uncomment this section of code to enable the test tone. This will generate a constant breathing rate of 27 and a constant heart rate of 108. Make sure you are getting this data correctly and seeing it in your MATLAB analysis.

    You can also do some additional testing by placing a metallic static object in front of the radar and observe the results.

    Regards,
    Kyle
  • Hi,

    I tested Test-Tone and got results.

    outPhase Plot:

    ant1_UnWrapPh Plot:

    The outPhase looks correct but ant1_UnWrapPh doesn't. I chose one specific rangeBin Index which have  max(abs(rangeProfile_cplx) by the way.

    Thanks.

  • Sorry,

    This is the data I used.

    testTone.txt

  • Ray,

    You should not be manually selecting the range bin for analysis. The processing chain of the vital signs lab determines which range bin to isolate and extract for further analysis.

    Regards,
    Kyle
  • Hi,Kyle,

    Thank you for your reply.

    I found the problem and post a new thread https://e2e.ti.com/support/sensors/f/1023/t/739935.If you can help me please let me know.

    Thanks,

    Ray