This thread has been locked.

If you have a related question, please click the "Ask a related question" button in the top right corner. The newly created question will be automatically linked to this question.

AWR1642BOOST: Problem about the sampling rate

Part Number: AWR1642BOOST
Other Parts Discussed in Thread: AWR1642

Recently, I have tried to analyze some data from mmWave Demo Visualizer 3.0. But I have a problem about the sampling rate of the sensor. 

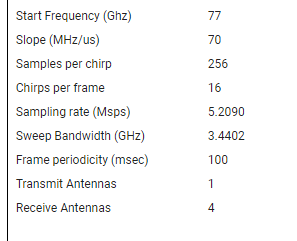
After I start the sensor, the chirp/frame information in the plot tab shows that:

According to this, there are 256 samples/chirp, 16 chirps/frame, and 10 frames/second. Hence, I can obtain there are 256*16*10=40960 samples/second. Does it mean the sampling rate?

On the other hand, from the figure above, the sampling rate is presented as 5.209Msps. Does sps mean samples per second? If so, why this value is different from the value above?

Moreover, I am confused with the definition of 'sample'. It seems this 'sample' is different from 'sampling points' in sampling theorem. Since the frequency of radar sensor is between 77 and 81 GHz, the sampling rate should be larger than 162GHz according to Nyquist rate.

Would someone please help me to solve this confusion? Thank you very much.

  • Li,

    I think you are missing a fundamental understanding of how these sensors function. I would direct you to the functional block diagram of the AWR1642 that you can see here:

    www.ti.com/.../datasheetdiagram.tsp

    From the diagram, you can see that there is a mixer on the incoming RX signal line following the low-noise amplifier (LNA). The RX signal is mixed with the TX signal being transmitted. This results in the difference between the two signals which immediately brings you down into the MHz range. At no point does this sensor attempt to sample in the 77 to 81 GHz signal range.

    Sps does mean samples per second. The 5.209 values does not necessarily need to match the 40960 value. As along as the sample rate is above the expected number of samples per second, the ADC will capture all of the samples that are specified in the profile configuration.

    Regards,
    Kyle
  • Hi Kyle,

    Thank you very much for your correct and quick reply.

    For the 5.209M not matching 40960 issue, is it means the 5.209M is the actual sampling rate, and 40960 is only for data output?
    This is because I used to extract information from the data file outputted by mmWave Demo Visualizer, and the number of ADC samples, i.e., 256, is utilized to calculate the size of range bins, and further the length of heatmaps.
    Is this correct? Thank you very much.

    Best regards,
    Li
  • Li,

    That understanding is correct. The 5.209M is the actual sampling rate and the 40960 is the data output.

    The number of ADC samples is used to calculate the number and therefore size of the range bins for the 1D FFT.

    Regards,
    Kyle
  • Hi Kyle,

    Thank you for your reply. My problem is solved now.

    Best,
    Li