This thread has been locked.

If you have a related question, please click the "Ask a related question" button in the top right corner. The newly created question will be automatically linked to this question.

DCA1000EVM: how can I use the raw data captured by DCA1000 iwr1642 to plot a range profile like postproc

Part Number: DCA1000EVM

hi,

I capture the raw data from DCA1000 using the function readDCA1000.

if I do fft on each of chrip, I will get the range profile, is right?

and I do this :

retVal = readDCA1000(fileName)

t = retVal(1,1:256);

plot(abs(fft(t)))

but I got the picture dose not right
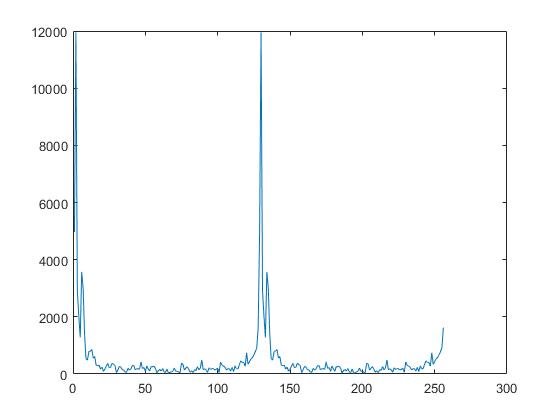
I know there is something wrong, how can I get the right range profile?

Best Regards.

  • Hello,

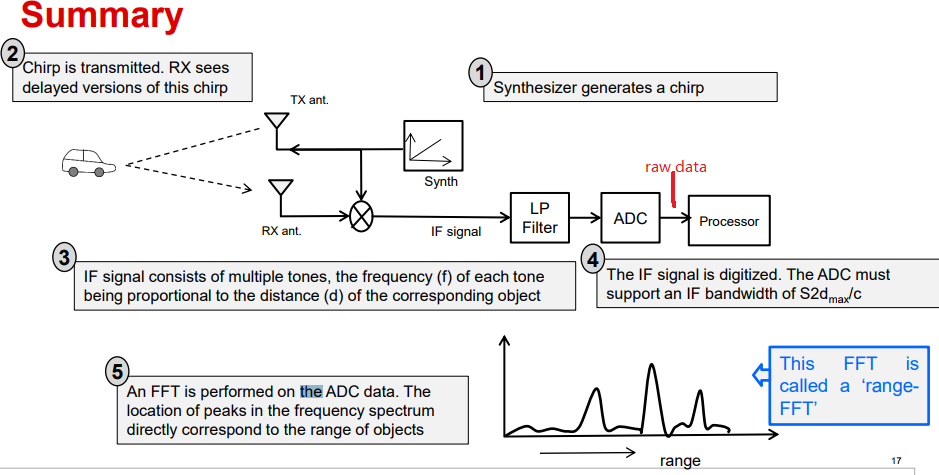
    Here is a video describing the algorithm for range detection.  Please reference this previous e2e post on fft post processing.

    I hope this helps.

    -Chloe

  • Hello, Chloe

    thanks for your reply,

    I am a beginner,  I have seen the video. and I think I got the raw data the red line position

    and I use the readDCA1000 function read the adc_data.bin 

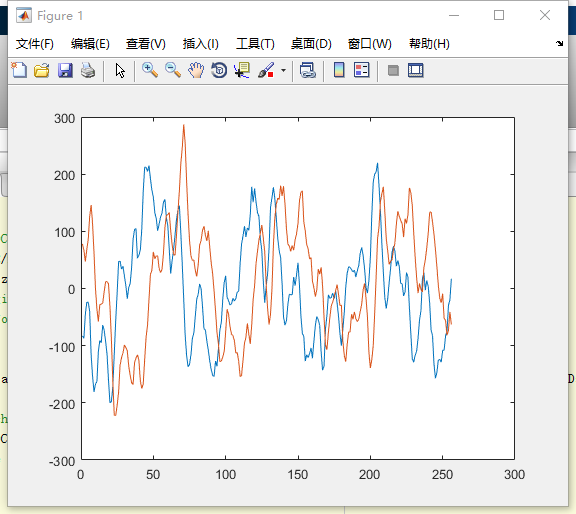
    I get the first chrip data (1x256 complex double )as follow:

    and follow the video, maybe I should perform an fft on data, and I can get the range-fft. but get the range proflie is what I mentioned at the beginning.

    Thanks alot for your help

  • Hello,

    Does your plot in mmWave studio post proc look different? Can you please send me the 1D FFt amplitude profile from the post proc window. This plot should give range detection. This is the plot you're trying to recreate, correct?

    -Chloe