Other Parts Discussed in Thread: IWR6843
I am having problem with displaying the result of a FFT on the raw data I get from the DCA1000.
I run a IWR6843 with the following config:
(In short, I run a CW wave of 61.250200GHz, sampling the input at digOutSampleRate or Fs of 2000Ksamples per second, 128 ADC samples at a time.)
(We have support for sampling raw ADC data using DCA1000 in continuous mode)
- flushCfg
- dfeDataOutputMode 2
- channelCfg 15 1 0
- adcCfg 2 1
- adcbufCfg -1 0 1 1 1
- lowPower 0 0
- contModeCfg 61.250200 0 0 6000 0 0 30 1 128
- guiMonitor -1 1 1 1 0 0 1
- cfarCfg -1 0 2 8 4 3 0 100 0
- cfarCfg -1 1 0 4 2 3 1 100 0
- multiObjBeamForming -1 1 0.5
- calibDcRangeSig -1 0 -5 8 256
- clutterRemoval -1 0
- compRangeBiasAndRxChanPhase 0.0 1 0 1 0 1 0 1 0 1 0 1 0 1 0 1 0 1 0 1 0 1 0 1 0
- measureRangeBiasAndRxChanPhase 0 1. 0.2
- aoaFovCfg -1 -90 90 -90 90
- cfarFovCfg -1 0 0 45
- cfarFovCfg -1 1 -10 10
- extendedMaxVelocity -1 0
- CQRxSatMonitor 0 3 4 63 0
- CQSigImgMonitor 0 127 4
- analogMonitor 0 0
- lvdsStreamCfg -1 0 1 0
- bpmCfg -1 0 0 0
The Tx is turned off on this receiving IWR6843 with its DCA1000 and I use another IWR6843 (call it "the transmitter") running at a CW of 61.25 (that is 0.2MHz below the receiver).
The result in the receiver after the initial input steps should be a wave of 0.2MHz samples at 2000Msamples/s.
Export is through DCA1000 as raw data and I then run it through a FFT in our python script.
But I have problems when I try to interpret the data and set the x-axis of the FFT plot for displaying the result.
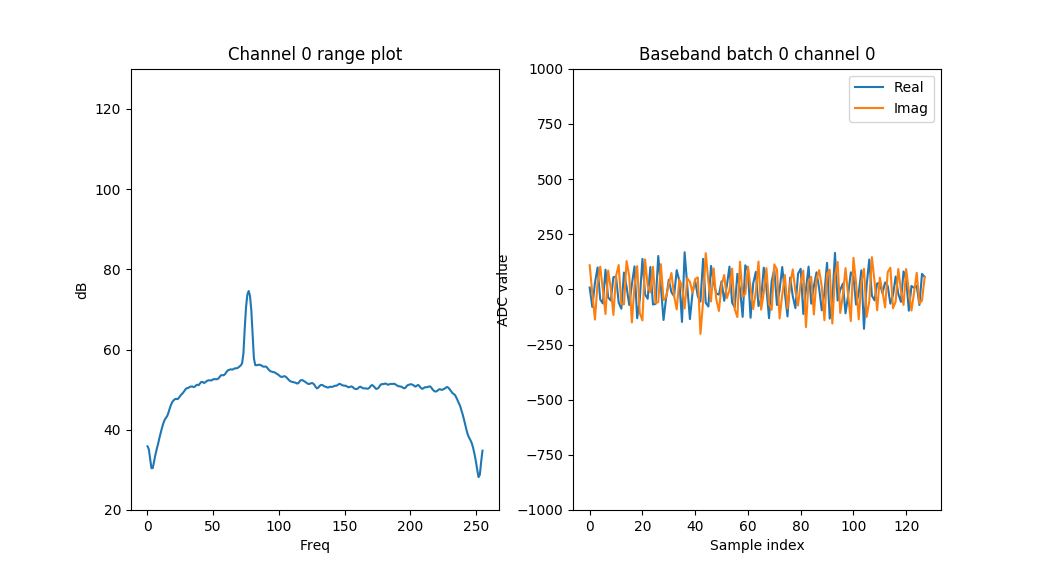
I get a good plot in general from the FFT, showing a clear peak which is the result of the transmitters frequency (I have tested removing the transmitter).
The peak resides in one of the 256 FFT-bins.
But when I try to translate that FFT-bin to a frequency, I do not get the 0.2MHz as I expected.
I must be missing something with either of the following:
-I/Q sampling is causing something to differ from a normal FFT on real valued samples are translated into a frequency spectrum.
-The frequency of the transmitter and receiver drifts a lot, I have seen drifting of about 1MHz in CW mode due to temperature maybe.
-Am I missing to do a FFT-shift of the data, translating it somehow thus getting the wrong frequencies? I refere here to the translation as: [1 2 3 4 5] -> [ 4 5 1 2 3] to get the DC centered in the graph.
Can you explain how to translate the output of the FFT on complex data (I set Complex 1x in adcCfg adcOutputFmt) to frequency?
As far as I understand it, the translation function from FFT-bin to frequency is as follows: freq (fft_bin_number) = fft_bin_number * Fs / length_of_fft
I see the peak in FFT-bin number 78 which translates to (78*2000 000 / 256 = 610KHz ) which is not the 0.2MHz which I expected.
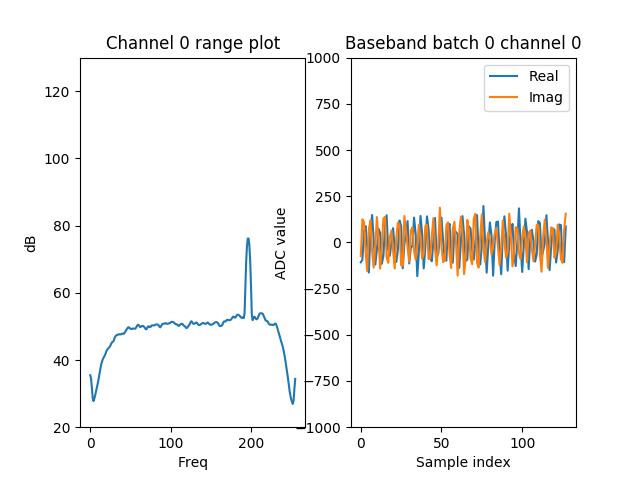
With a fft shift the FFT-bin 78 is shifted to 78+128 = 206.
Which also does not give the expected frequency. It gives 1.609MHz not 0.2MHz.
I guess everything can be explained with the fact that the frequency drifts in CW mode with up to 1MHz I think, so it is really hard to come to any conclusion I guess.