This thread has been locked.

If you have a related question, please click the "Ask a related question" button in the top right corner. The newly created question will be automatically linked to this question.

CCDebugger won't connect to CC2541

Other Parts Discussed in Thread: CC2541, CC2531, CC2540

CCDebugger won't connect to CC2541. CCDebugger works fine with the SensorTag dev kit I have, CCDebugger firmware is latest.

Custom board based on the CC2541-CC2590 reference design.

Debug pins are connected to GND, VCC, DD connected to P2_1, DC connected to P2_2, RESET connected to RESET_N (there is no filter here, could that cause the traces below?)

DCOUPL and RBIAS voltages are correct, and ground pad is soldered.

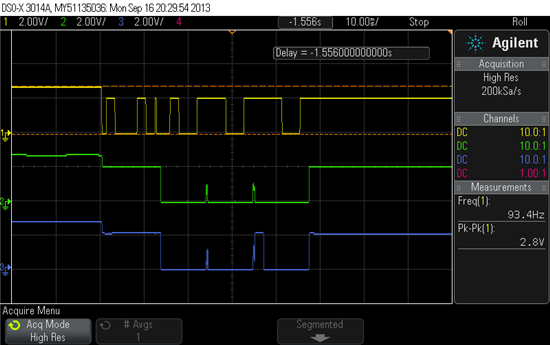
Working SensorTag: (yellow is RESET, green is DC, blue is DD)

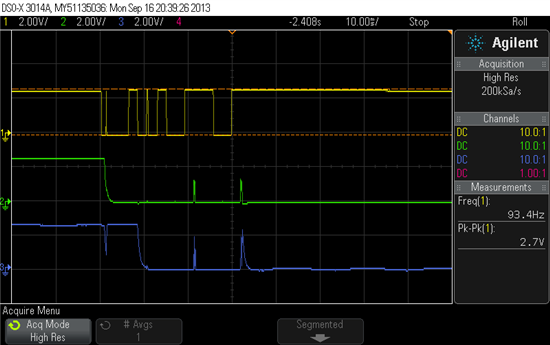
My board:

Have tried three builds of the board, all behave the same. Ideas?

  • Oh, and the basic problem is that the CCDebugger light remains red, even after hitting reset.

  • I have similar Problem, 

    I am conencting the CCdebugger to my custom DIP adapter for CC2541 according to the CCdebugger manual, to connect the minimum debugging conenction (9p8. manual). The led is red and immediately when I connect the JTAG VCC to the breadboard with the CC2541 the Debugger LED turns of and the Debugger disappears from the SmartRFStudio menu ?

  • Normally problems like this is due to connection errors.

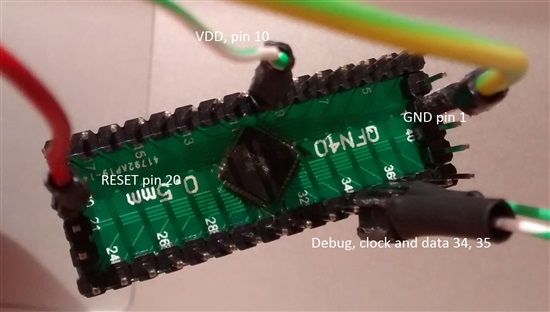
    If you post a picture of your setup where it's easy to see which pin on the debugger is connected where on your board we can try to figure out where the error is

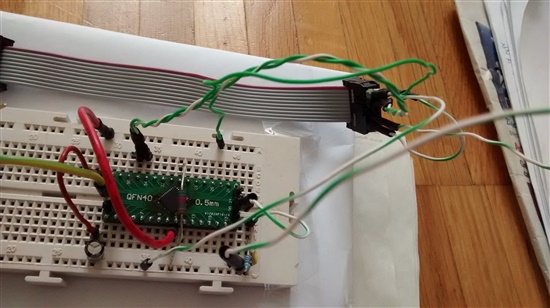
  • OK, so here is a very basic setup that I tried after trying to connect the chip to a veroboard with RESET filter failed.

    PIN Connections:

    CC2531- JTAG

    1 (GND) to 1

    10 (VDD) to 2 (and also to Vcc supply in JTAG pin 9) 

    34 (P2.2) to 3

    35 (P2.1) to 4

    20 (RESET) to 7

    So just those pins, no filters and no pull up resistors, I understood from the forums that it should be possible to connect the Debug interface without the Reset filtering as long as it keeps high (active low).

    I have tried this setup with CC2541 & CC2531 (soldered into the adapter DIP PCB), but I dont know how to check the actual soldering connections to the adapter except by visual inspection.

    Sorry for the crappy image I can make a better one tomorrow if necessary !

    Thanks in advance,

    Robert Nawfal

  • E Sherry; form your plots it could look like you have a bit too large RC constant.


    Robert, it is not possible from the picture to see where on the debug header the wires are soldered. Do you have a plot?

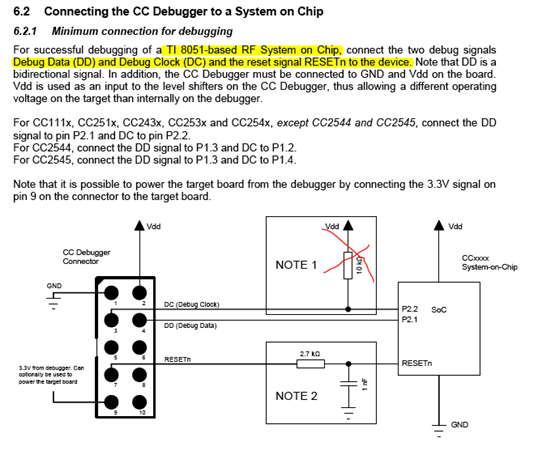
  • Thanks for the reply, unfortunately I havent made yet a specific plot but I used the one from CC debugger manual p8. ch 6.2.1. MInimum connections for debugging

    https://www.dropbox.com/s/f8iic7vxj0hrpqi/Screenshot%202014-06-03%2000.19.36.png

    So as I tried to explain above I got fed up with the breadboard trying to connect the filter for the RESETn and I tried just straight connections as above in the picture my PCB (mounted CC2541) and to my JTAG connector for the CCdebugger. But either way (breadboard with filter & straight connection with no RESET filter) only turns of the Debugger red LED. So the led is lit until I actually connect the ground or Vcc, I have tried and there should not be any shortcircuits eventhought thats what I expect (maybe in the PCB I soldered) or then there is something wrong with my CCdebugger. 

    I can connect the debuuger to smart rf studio and I have updated the latest firmware to it. It is succesfully detected without a chip but as soon as I connect the Vcc or GND the debugger disappear from the  Rfstudio and the red LED turns off. ??? Any idea how to proceed ?

  • If the Debugger disappear from Studio when you connect Vdd/ gnd I would suspect a short or a connection to the wrong pin. Have you tried to monitor the power when you connect Vdd/ gnd to see what happens?

  • I agree with TER. You most probably have a short circuit somewhere. It is not normal behavior that the LED is turned OFF when connecting the debugger to a target board. 

    Try to measure the voltage on e.g. pin 9 of the debugger when you connect it to your target. Also verify the voltage on your target board.

  • I just checked the voltage over the GND to Vcc pins in the JTAG connector when connected to the chip and it indeed Drops from 3,3 Volts to nearly 0 Volts. So it seems I have a short circuit.

    I re-checked the PCB soldering and it seems ok, no shorts. I dont think my cables are shorted. so the problem might lay on the way I look at the Debugger datasheet connector picture, maybe I have it twisted. or smth. But that doesnt make sense either since I have tested that the voltage of 3,3 volts is visible. So the idea I am left with is that the Chip itself somehow makes a short when it gets the voltage of 3,3.

    Another point that I thought about now is that the heat cooling/ GND pad under the area of the chip is not soldered to the chip. (I dont know how to solder there under the chip for the grounding pad)

    Thanks for any tips.

  • If you upload a better picture that shows clearly your connections to the debugger we will be able to see if you have than bit correctly.

    As the datasheet state, the die paddle (GND pad) under the chip is ground to the chip and it will not work without this. For soldering QFN etc consider something like this: http://www.directindustry.com/prod/unitemp-gmbh/digital-laboratory-hot-plates-61496-697685.html

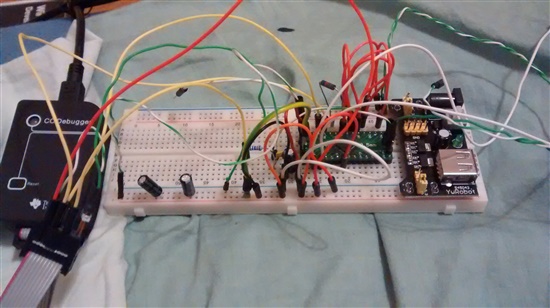
  • So I hope these pictures are a bit better, in the pic I had the red line connected to the 5 pin but I actually tried the pin 7 in the CC debugger which is meant for RESET.

    and the other end ...

    So, I do feel a bit rookie, not getting this done by myself but I really appreciate if you guys can help to get started.

    I did reflow solder the Ground plane, but since I have no previous experience with them, I must clarify if the ground plane under the chip is meant only for heat transfer or does it actually have to be connected to the GND of the debugger, in other words should I connect the GND pin 1 on the CC2541 to the plane under the chip and then to the debugger ?   

    I found this thats why I m wondering...

    Application Report
    SLOA122–July 2006

    "

    The thermal pad is usually tied to ground, and designers should verify the electrical
    correctness when connecting the copper planes to the thermal pad

    "

  • OK I did some additional testing and found out that the shortcut between Pin 1 GND and pin 9 VCC external 3.3  appears in my CCdebugger only when I plug the USB to my PC, unplugged there is a 0.6 V.

    Is this normal behaviour ?

  • Is it possible for you to upload the layout? From your description/ question it sounds like you may have done something strange here.

  • Layout of the QFN to DIP adapter or which layout ? Unfortunately I dont have the layout of the Adapter PCB but that is a simple PCB with only traces to the pads no additional components. And what comes to other layouts I have no other than the above posted schmentaic pic from the datasheet with the minimum debugging connections. 

  • I've been focusing on the interface and the ground pad so I haven't looked too closely at your PCB before now. But CC2541 needs a minimum of external components to work (crystal Rbias etc) Without the external components in place you will not be able to connect to the chip with the debugger.

  • RBIAS resistor, DCOUPL cap and some decoupling of the voltage supply are the absolute minimum. A crystal is not required for programming.

  • So I reassembled the Circuit shown in CC2541 Datasheet 1581.cc2541-datasheet.pdf

    p.24

    for application information a sample circuit is presented there and I have connected the Rbias (R301) 56 kOhm, Decoupling (C401 1 uF, 50 V ELKO), and the RESET RC filter, presented in the CCdebugger manual, but the same problem keeps resisting with the debugger LED turning from RED to OFF when I connect the GND or VCC of the circuit.

    I have ordered now another USB bluetooth kit to try to connect the debugger to it to verify that the debugger actually works... 

    I understood from the datasheet that the 32kHz crystal is voluntary, or? 

  • Hi Robert,

    Have you managed to connect the debugger to the CC2541 yet? I had a brief look at your scope plots, but they don't show enough details. Try to zoom in on the activity on DC/DD to verify that your'e not filtering out the clock transitions. Remember to measure close to the device.

    Yes, the 32kHz crystal is optional.

  • Ok so tonight I got verified that my CC debugger is actually able to connect to the CC2540 USB dongle EMK development kit via IAR embedded systems. So the debugger works properly.

    I will get back to my DIP adapter for the CC2540 BLE chip trying to establish a connection to my own prototype...

    The scope plots are not from me, My Oscilloscope Rigol 1002E is in the mail. Finally

  • Hey Sherry,

    Did you manage to establish a connection in the end ?

  • I have now received a new bretboard and I assembled the CC2541 again with the JTAG debugging connection:

    PIN2 Voltage sense (connected to Vdd)

    PIN1 GND

    PIN3. DebugCLK

    PIN4. DebugData

    PIN7. reset (to a RC filter like in datasheet)

    PIN9. Vdd

    Extra: 10uF & 1uF decoupling ELKOs between Vdd and GND

    The Ground pad of the CC2541 is also soldered and connected to the ground of the JTAG

    I would like know what exactly are the PINs I have connect to get a connection to the CCdebugger???

    I have of course had a look at the datasheet several times but I am missing something.

    I havent conected the SPI (MISO, MOSI, CLK, data)

    So the RED LED in the Debugger still turns off and I get a voltage reading of 0,9 V between Vdd and GND. So if I disconnect the Vdd or the GND the RED LED lits on again, but I cant find a short cut with multimeter between the Vdd and GND.  

  • I suggest you take a few steps back and disconnect the wires on the debugger cable.

    Start out with only connecting GND from the debugger to your prototype board. Make sure the GND connection is rock solid and that there's no voltage difference between the GNDs. Also verify that the RBIAS resistor and DCOUPL cap are in place.

    Next, connect VDD only (pin 9) from the debugger to your board. Verify that the RED LED is not being turned off and measure the voltage on your board. It should be 3.3V.

    Next, connect VDD from your target board to pin 2 on the debug connector. Again, verify the LED (should be RED) and measure the target voltage, which should still be around 3.3V.

    One thing to note: The debugger is only able to supply up to 250mA. If you have some other current-hungry device connected, you should power your board from a different supply. To make sure you're not using too much current, connect an ammeter between the VDD pin 9 on the debug connector and VDD on your target.

    Next, connect RESET (CC2541 pin 20), then Debug Clock (CC2541 pin 34) and then Debug Data (CC2541 pin 35). Once the RED LED is turned off, you have identified the problematic connection.

  • Unfortunately I still could not get it working, after connecting GNDs, RBIAS, DCOUPL cap and the Vdd to my protoboard (veroboard), I did measure 3.3V but as soon as I try to connect any of the Target board (CC2541 soldered on a addpter PCB) DVDD (e.x. pad10 or 39) or AVDD (e.x. pad 31) the debugger red LED turns off ???

  • It might also be worth checking the adapter board itself for shorts. It is clear the there's some short there somewhere. Maybe you have too much solder paste under the chip and that the excess paste is in contact with some other pads.

    Maybe the chip you have has been damaged. Try replacing it with another (you get free samples from TI). Also, while the chip is desoldered from the adapter, do the same excercise as above.

  • Robert: What is your main purpose with what you are doing at the moment? If you want to develop software you could do that on the EMK.

    Working with a veroboard and an adapter board is very error prone and I don't see an advantage working with this type of platform compared to other options.

  • Hello TER,

    I do have en CC2541 USB bundle and I actually decided yesterday to switch working with that to be able to connect to an ADS 1292 Analog front end to make an ECG amplifier. 

    I wanted to learn from scratch how to design a uC PCB (with CC2540) that actually works and I thought I could make the initial setup with a Veroboard and then design & order the PCB since I dont have the etching equipment at home.

    So I guess I will now work with the CC2541 USB bundle and connect its extra SPI to my ADS.

    In parallel I will try to get the chip itself (CC2450) working on a PCB, I probably need to read a bit more about how it should actually be done. Any suggestions for references or good chapters to read ??? 

  • What happens when you miss the 2.7k resistor. I put a PULL UP resistor of 56k and a pull down capacitor of 1nF in the design.

    So, in order to use the board can I use a regular through hole 2.7k resistor rather than the 0402. Else, is there are any other way around this?

    I seem to have screwed up also with the Decoupling capacitor - I put a through mount tantalum capacitor (I didnt know that there were tantalum caps which were of the 0402 variety). Will the design fail because of this? Also, will I have to compulsorily use a tantalum capacitor for the Decoupling capacitor?

    Is there anything special I need to keep in mind for the Bias resistor? Any special kind of resistor needed?

    Because of this my chip is not being recognized. Please do help.

  • Syfiyan: What sort of hardware are you working with?

  • I am using the CC2541 with 128kb Flash memory.

    I am using - FA20H from Epson Technology for the 32Meg Hz crystal and the FC12M from Epson Technology for the 32 kHz crystal.

    For the Balun Filter I am using 2450BM15A0002E from Johanson Technologies and the Antenna I am using is the 2450AT42A100E from Johanson Technologies.

  • Yes, but on a PCB you have designed or something else? If PCB, please post a schematic.

  • Sufiyan - You'll get a much longer time rise/fall time on the reset line with that resistor value, but as long as it is well within 2ms, the debugger should be able to handle it.

    You do not need to use tantalum caps.