

Step-by-step calculation of gauging accuracy and other factors affecting accuracy
In part 1 of this series, I discussed the difference between measurement accuracy and gauging accuracy. I highlighted that gauging accuracy depends on the accuracy of input variables (voltage, current and temperature) into your chosen algorithm, as well as the algorithm’s robustness, or the ability to account for different battery use cases. I also pointed out that you can quickly evaluate the accuracy of a gauge by inspecting the state of charge to confirm that the gauge reports 0% near the terminate voltage and that the SOC doesn’t experience significant jumps.
An even more effective method is to compute gauge accuracy across the battery’s entire discharge profile. You can do this with the charge profile as well, but because users are more concerned about accuracy during battery discharge, accuracy is often evaluated using the battery discharge profile.
Here is a step-by-step method to calculate gauging accuracy: (Download this Excel sheet has actual numbers and formulas)
1. Start with a gauge log in Excel of the voltage, current, temperature and reported SOC. In part 1 of this series, I mentioned that you can extract the gauge log using bqStudio and a TI gauge EVM or any gauge and an Arbin or Maccor. In this example, I will describe the process using a gauge log from bqStudio and a TI gauge EVM.
2. Create a new column for calculated passed charge (dQ). The log file should start from a fully charged state and end at the terminate voltage, where empty is reached (or wherever discharge stops). Use the Excel formula below to calculate each row of passed charge:
- Calculated_dQ = rolling sum of current_reading * time_since_last_log_point.
- Excel formula: (ElapsedTimeN+1 – ElapsedTimeN)*|AvgCurrentN| /3600+ Calculated_dQN-1. (Since the unit of elapsed time is in seconds, convert it to hours by dividing by 3,600. Calculated_dQN-1 is the immediate previously calculated passed charge.)
3. Calculate the battery’s true full-charge capacity, which is the sum of all the passed charge:
- FCC_true = integrated capacity, from fully charged state down to termination voltage.
4. Create a new column and calculate the battery’s remaining capacity (Calculated_RM) at each point along the discharge profile:
- Calculated_RM = FCC_true – Calculated_dQ.
- Excel formula: $FCC_true – Calculated_dQN.
5. Calculate the battery’s true state of charge (Calculated_SOC) in percentage at each point in a new column:
- Calculated_SOC = Calculated_RM / FCC_true * 100.
- Excel formula: Calculated_RM / $FCC_true * 100.
6. Calculate the state-of-charge error reported by the gauge at each point in a new column by subtracting the state of charge reported by the gauge from the calculated state of charge:
- SOC_error = SOC_true – SOC_gauge.
- Excel formula: Calculated_SOCN – SOC_gaugeN.
The Excel sheet shows the calculation details. In Figure 1, the different highlighted columns represent the different steps in the calculations. As you can see in column M, the SOC error magnitude clearly quantifies gauge accuracy.
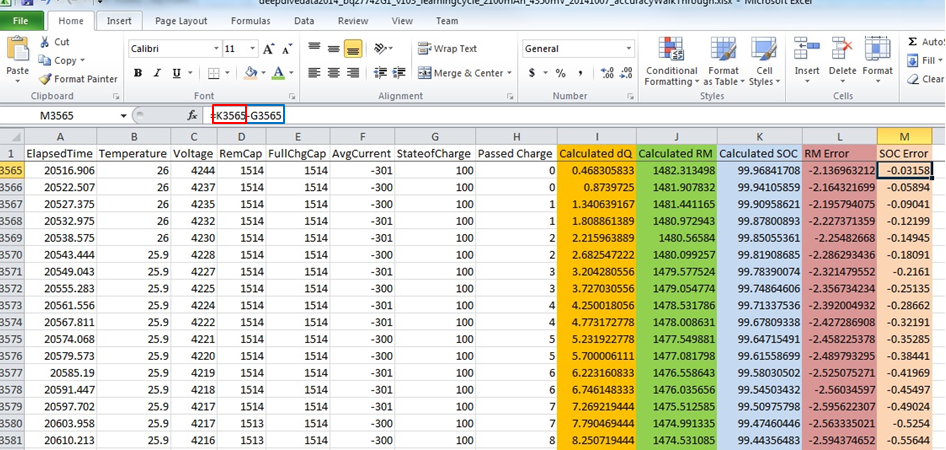
Figure 1: Excel log showing an example for calculating SOC error
Figure 2 compares the calculated SOC and the SOC reported by the gauge across the battery’s entire discharge profile, while Figure 3 shows the magnitude of the SOC error graphically. In this particular example, you can see that the error in gauge accuracy across the entire discharge profile is less than 2%.
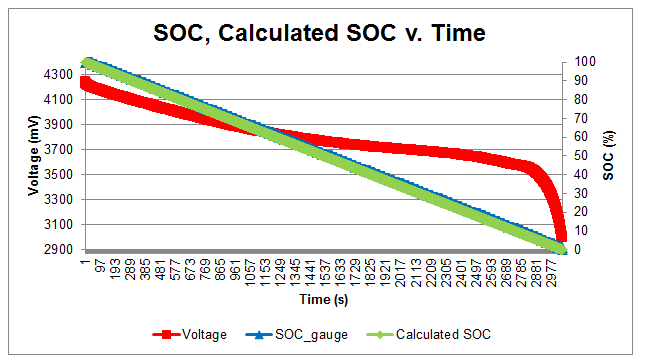
Figure 2: Visualization of calculated SOC vs. reported SOC across the battery’s voltage discharge profile
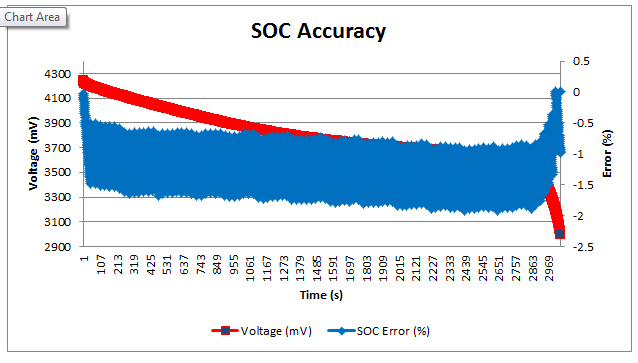
Figure 3: Visualization of SOC error across the battery’s entire voltage discharge profile
Changes in ambient temperature and discharge current rate can cause the battery capacity (FCC) to increase or decrease, which is an inherent battery characteristic. These changes result in sudden jumps in the state of charge, leading to an unpleasant user experience. In order to curb this, most Texas Instruments gas gauges have a special feature called smoothing. The smoothing algorithm’s main goal is to smooth out the jumps in remaining capacity and SOC over the course of battery charge or discharge. Note that if this functionality is enabled, the gauge’s reported remaining capacity and SOC will be mathematically modified and may not be a true representation of the battery’s state of charge. When calculating accuracy if this filtering is enabled, determine whether you want to use the smoothed (filtered) values or the true values: the gauge has the capability to report both.
Figure 4 compares the calculated actual SOC, the gauge-reported filtered SOC and the gauge-reported true SOC under multiload levels. You can see that the gauge-reported filtered SOC closely follows the gauge-reported true SOC.
Figure 5 compares a gauge-reported SOC error and a gauge-reported filtered SOC error. A more visible difference between the filtered and true gauge SOC would occur if there was a steep temperature change, which will result in a battery capacity change.

Figure 4: Comparison between the battery’s calculated true and gauge-reported SOC under multicurrent levels
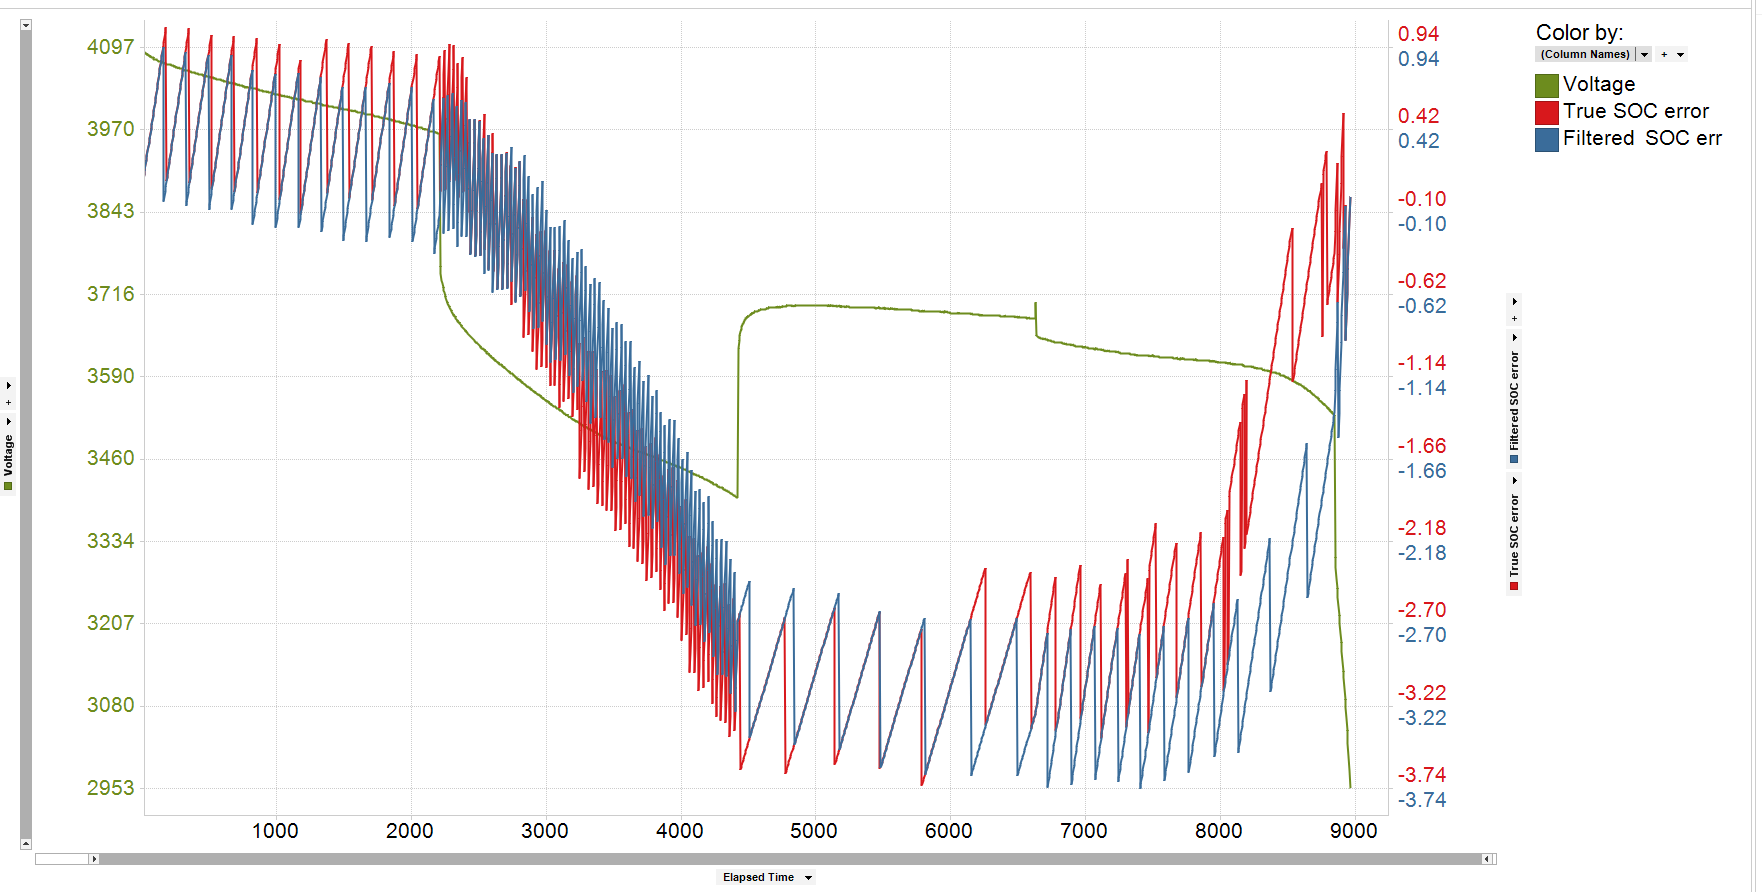
Figure 5: Comparison of gauge-reported SOC errors across the battery’s voltage profile under multicurrent levels
Most gauge users need some capacity in the battery reserved when the gauge reports 0% without hitting the terminate voltage so that the host processor can perform a controlled system shutdown. In cases like this, when evaluating for accuracy, do not carry out your calculations down to the terminate voltage; rather, calculate to whatever voltage threshold corresponds to the amount of reserve capacity you need left in your battery.
Another factor affecting gas gauge accuracy over a battery’s lifetime is the gauge’s ability to track the battery’s changing impedance, which increases as the battery ages. TI’s Impedance Track™ gauging algorithm offers up to 99% accuracy over a battery’s lifetime due to its ability to track the battery’s changing resistances. Our compensated end of discharge voltage (CEDV) gauging algorithm offers up to 98% accuracy and accounts for aging mathematically, using a battery model that may become less accurate as the cell ages. Our Impedance Track-Lite algorithm is a simplified version offering up to 95% accuracy.
In summary, calculating state-of-charge error is a more robust method for evaluating gas gauge accuracy when compared to visual inspection, given that it provides the magnitude of error across the entire battery profile. Other considerations affecting gauge accuracy and its evaluation are smoothing activation, reserve capacity functionality and the gauge algorithm’s ability to track cell aging. For a comprehensive list of the various gauge offerings, visit ti.com/gauges.
Additional resources
- Read part 1 of this blog post: How accurate is your battery fuel gauge? Part 1/2.

