
This technical article was updated on July 23, 2020.
Last week, I replaced the carpet in my house with wooden flooring. After removing the carpet from the staircase in our living room, I noticed my “uniform” staircase actually had very uneven steps. This was a surprise to me, because in all the years I walked up and down the same staircase, I had never noticed this unevenness. The carpet did a masterful job of obscuring it.
And because I think like a nerd, this observation got me thinking about high-resolution SAR analog-to-digital converters (ADCs). My staircase, which I assumed was uniform, actually resembles the ideal transfer function for a noise-free ADC with quantization steps of perfect symmetry. An example appears in Figure 1 for the case of a 3-bit ADC.

Figure 1. ADC transfer function – “uniform staircase”
So thinking like a nerd again, that not-so-perfect staircase in my home has steps that are non-linear in size (Figure 2) in much the same way that an ADC’s code transitions are never perfectly symmetrical. In the ADC world, this lack of symmetry is defined by two terms, differential (DNL) and integral (INL) non-linearity errors. These errors result from the inherent mismatch of capacitors and resistors inside the ADC.

Figure 2. ADC non-linearities – “actual staircase”
Furthermore, the carpet on my staircase acted like a layer of DC “transition noise” that gets added (and superimposed) to the ADC transfer function (Figure 3). This noise comes from the ADC internal circuitry, including the reference source. The noise floor can hide the true non-linear shape of the ADC staircase response.

Figure 3. ADC non-linearity noise – “carpeted staircase”
Like the staircase in my home, this information is not obvious in an ADC datasheet. Nevertheless, the ADC specification table lists a typical value for the noise power, or rms value, of the “transition noise”.
Another place to find this value is the DC histogram plots in the “typical curves” section of the datasheet. This output code spread represents the peak-to-peak value of the transition noise, which is usually equal to few LSBs. Figure 4 illustrates this for the case of ADS8881, an 18-bit SAR ADC.
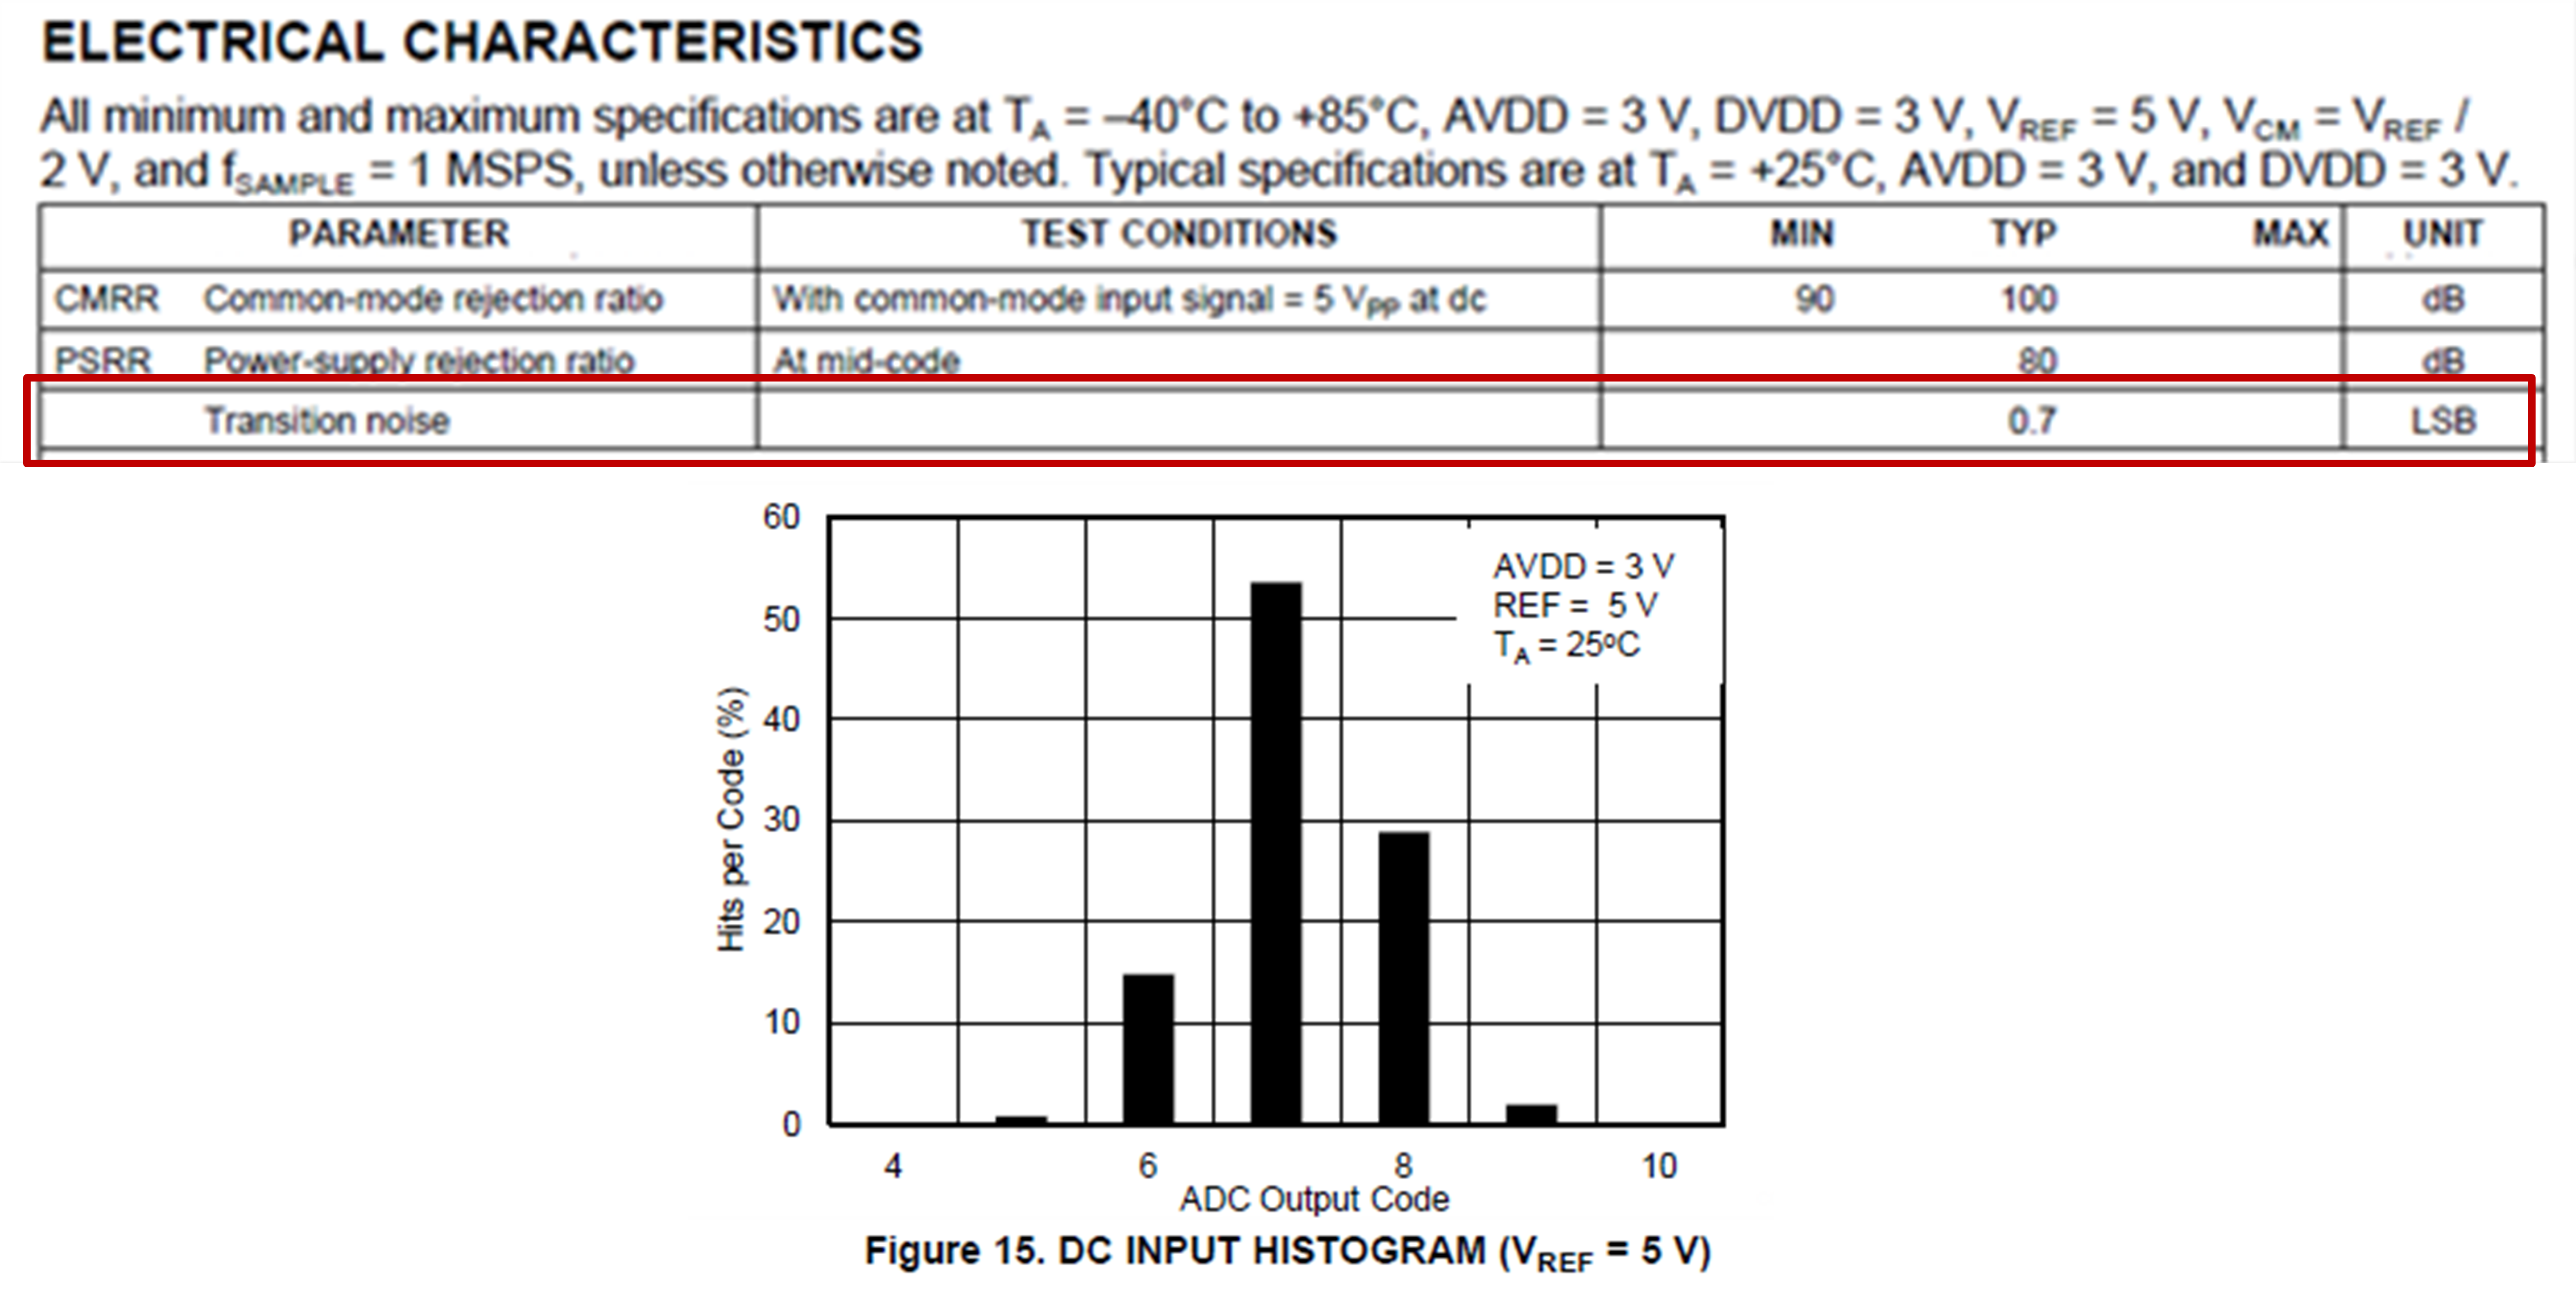
Figure 4. ADS8881 datasheet showing transition noise and DC histogram curve
And what about using DNL/INL to quantify the “unevenness” of the staircase? It is sometimes difficult to understand how DNL/INL can be both measured and guaranteed to more precise levels than the peak-to-peak transition noise.
Take the ADS8881 (Figure 5) as an example. How can we show a DNLMAX specification of 1.5LSBs when the ADC output can show up to +5LSBs of error due to transition noise? Conversely, how could we expect to see the unevenness of a staircase with the carpet covering it?
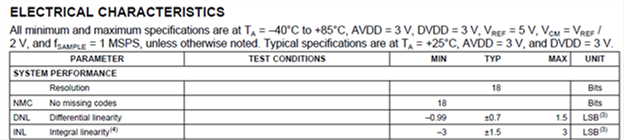
Figure 5. ADS8881 datasheet showing DNL and INL specifications
I’ve already given you the answer—remove the carpet! Likewise, in order to measure the true linearity (INL/DNL) of a high-resolution ADC, you need to look below the noise floor by first removing the dc transition noise.
In the ADC domain, averaging is the main tool to remove the noise “carpet” so you can measure the correct INL/DNL. This is because transition noise exhibits the nature of white noise.
You can perform averaging by applying a known voltage from a very stable reference or digital-to-analog converter (DAC) output. Then you can perform multiple samples and conversions of the stable input voltage and average the digital output codes to determine the linearity of that specific point.
So, if you ever find yourself fumbling through an ADC data sheet, take a moment, channel your nerdy thoughts, and think about my staircase analogy. Understanding ADC non-linearity is all downhill from there!

