In this three-part blog series I’ve been explaining how to select an op amp with sufficient bandwidth for your transimpedance amplifier circuit.
Catch up by reading part I. In part II I began a design example using this process to select an op amp to meet these circuit requirementsand determined the required op amp bandwidth is 5.26MHz.
Table 1: Example performance requirements for a transimpedance amplifier

Now we’ll compare two op amps, one which meets this requirement and one that does not:
Table 2: Gain bandwidth product comparison of two op amps for the design example.

Phase margin comparison
Phase margin is one metric of stability which compares the phase of the loop gain (AOL * β) of an amplifier to 180 degrees at the point where loop gain equals 0dB. A phase margin of 0 degrees would indicate that negative feedback has become positive feedback and the system is unstable. Phase margin can be measured using the circuit from part II (Figure 1) which breaks the feedback loop. The phase of the AOL * β voltage is measured (Vout probe) at the frequency where its magnitude is 0 dB.
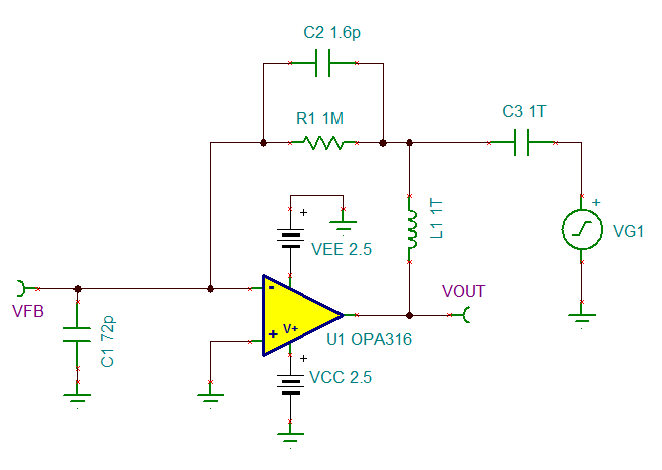
Figure 1: TINA-TI™ simulation schematic for evaluating phase margin.
Figure 2 shows the result of an ac transfer characteristic simulation in Tina-TI using the OPA316. From the cursors we can see that AOL * β = 0dB at 232.455 kHz and the phase margin is 66.66 degrees.
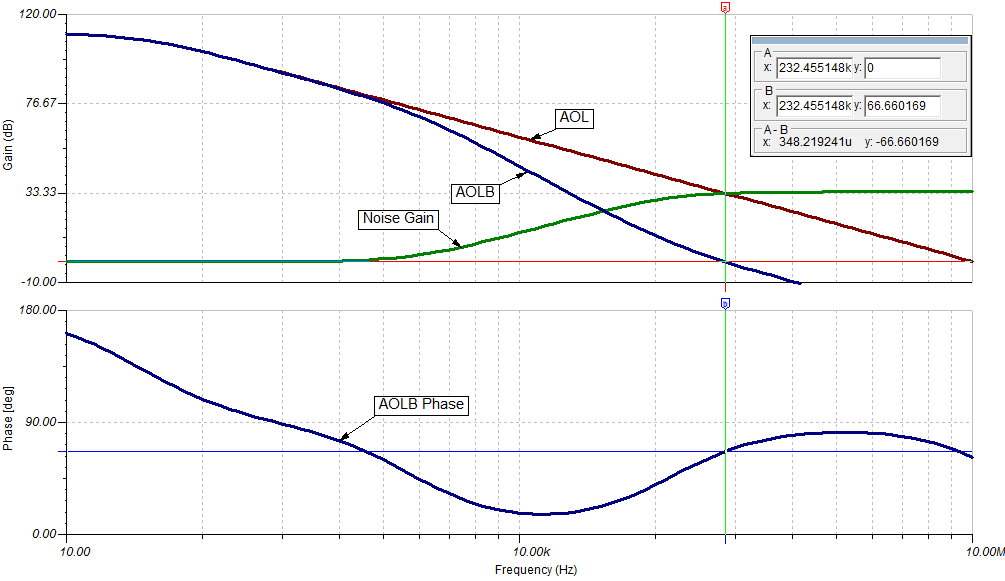
Figure 2: Bode plot of the loop gain for determining phase margin
Repeating this analysis with the OPA313 gives a phase margin of 31.65 degrees. Technically, this part is still stable with this amount of phase margin but it would not be considered a robust design. If a large number of these circuits were produced, a few may be unstable due to the tolerances of the op amp’s specifications.
Step response comparison
Reduced phase margin has other ramifications. For example, it causes overshoot and ringing in the circuit step response. To show this effect I applied a 1uA current step (IG1) to the input of the circuit and measured the time required to settle to 0.1% of the ideal value using a transient simulation.

Figure 3: A 1uA current step is applied to the input to simulate step response.
The step response of the OPA316 shows minimal overshoot and settles to 0.1% in 13μs. Conversely, the OPA313 shows significant overshoot and ringing in its response and requires 75μs to settle to 0.1%

Figure 4: Step response of the OPA316 (blue) and OPA313 (red) for a 1uA input current step (green).
Amplitude response comparison
Finally, the reduced phase margin will cause peaking in the transfer function of the circuit. Figure 5 displays the amplitude response for the two op amps. The OPA313’s transfer function exhibits a 5 dB peak in gain which may not be acceptable. Even worse, the -3dB point when using the OPA313 is 78.47 kHz.

Figure 5: Frequency response comparison of the transimpedance amplifier built with the OPA313 (red) and OPA316 (blue).
On the other hand the OPA316’s transfer function does not show peaking and has a -3dB point of 134.41 kHz.
Conclusion
A look at the scoreboard for this comparison shows the OPA316 is better able to meet our design requirements:
|
Op Amp |
GBW |
PM (Deg) |
Settling (0.1%) |
BW |
|
OPA313 |
1 MHz |
31.65° |
75μs |
78.47 kHz |
|
OPA316 |
10 MHz |
66.68° |
13μs |
139.41 kHz |
But this should not be a surprise!
Our 3-step process resulted in a minimum gain bandwidth requirement of 5.26 MHz. Below this value the stability, settling and bandwidth of the circuit is compromised. Hopefully the 3-step process outlined in this series will help you to quickly choose the appropriate op amp for your transimpedance amplifier; or at least help narrow the choice down from the 1375 options from TI!
Sign up to get these posts pushed to your inbox by scrolling back to the top and click on this -->