

When responding to questions posted on TI E2E™ Community forums, we frequently run simulations using TINA-TI™ software, a SPICE-based simulation program. Since we are always in the process of updating our simulation models, we sometimes run across SPICE models that are old, outdated or incorrect when modeling performance parameters.
One recent example involves the voltage-noise density of the OPA2333 macromodel. Unfortunately, we found that the model’s voltage-noise density curve was less than that given in the data sheet. So in this blog post, I will show you how to verify an operational amplifier’s (op amp) voltage-noise density curve and correct it if necessary.
First, you need to know how to generate a voltage-noise density curve using TINA-TI software. In this example, I will use the OPA2333 macromodel and schematic shown in Figure 1.
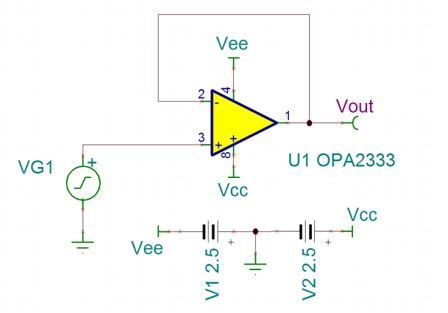
Figure 1: TINA-TI test bench for voltage-noise density
The output noise in this configuration uses the op amp with no gain, filtering or other factors that would change the voltage noise over frequency.
To simulate the output noise, select Analysis > Noise Analysis, and tick the Output Noise check box shown in Figure 2.

Figure 2: How to find noise analysis for output noise

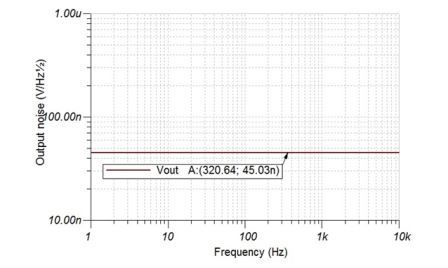
Figure 3: Simulated OPA2333 voltage noise

Figure 4: OPA2333 voltage noise according to the data sheet
You can add noise to the macromodel by inserting a voltage-noise source in the schematic.
To get the voltage-noise source, go to File > Open Examples. Select the Noise Sources folder and open the TINA Noise Sources.TSC file shown in Figure 5.
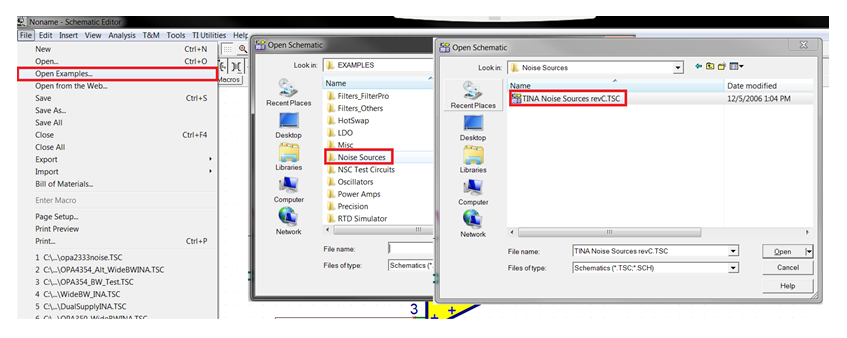
Figure 5: Finding the voltage-noise source and equivalent op amp noise model
Now, copy and paste the voltage-noise source from the noise-source schematic into the testing schematic and add it to the noninverting input, as shown in Figure 6.

Figure 6: Testing schematic for input-voltage noise with a voltage-noise source
Double-click on the noise source and select Enter Macro. A tab will open showing the netlist of the voltage source; see Figure 8.
Since the OPA333 is a chopper op amp and has no flicker noise, you do not want to add flicker noise to the voltage source. Find the parameters NLF and FLW and change them to 0 and 0.1, respectively. This sets the flicker noise to 0 nV/ √ Hz at 0.1Hz. You will also need to adjust the broadband noise so that the root sum square (RSS) noise is equal to the value you want. In the netlist, this value is represented by the parameter NVR.
In Figure 7, I solve for the desired broadband voltage. Figure 8 shows the updated parameters inside the netlist.

Figure 7: Solving for the broadband voltage-noise value
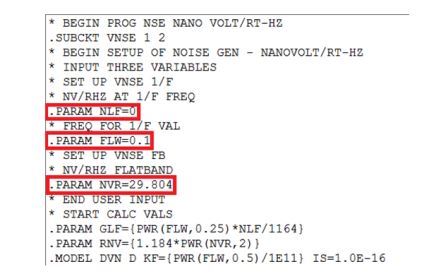
Figure 8: Netlist of voltage-noise source
Running the noise analysis again (Figure 9), you can see that the voltage noise is now the same value shown in Figure 4.

Figure 9: Corrected op amp voltage noise
Note that this process only works when your macromodel’s voltage-noise density curve is less than that given in the data sheet because RSS noise can only be added. If your macromodel’s voltage-noise density curve is more than that given in the datasheet, the TI Precision Labs on-demand training series includes a short video on how to create your own accurate macromodel for noise simulations. You can find the video here*.
Remember, trust your SPICE models, but verify that they are correct. Simulations can take you far, but they need to simulate correctly to produce meaningful results.
Additional resources
- Learn more about noise, how to calculate it and how to simulate it correctly with our online training series, TI Precision Labs – Op Amps.
- Learn how to trust and verify your SPICE macromodels in Tim Green’s blog post, “SPICE op amp macromodels: ‘Trust but verify’.”
- Find commonly used analog design formulas in our wildly popular and free “Analog Engineer’s Pocket Reference” e-book*.
- Read more blogs about precision amplifiers.
- Learn about TI’s entire portfolio of amplifier ICs and explore technical resources.
*This requires a myTI log-in.

