Does debug affect optimization? Does optimization affect debug?
A compiler’s main job is to generate instructions and data directives that implement your C/C++ source code. However, compilers have additional responsibilities. For example, compilers act as code-optimization tools, performing program transformations that improve the execution time and reduce the memory footprint of your source programs. Compilers are also responsible for emitting debug information used by debuggers to keep track of things like where variables are located and how to map an instruction address to a C source line.
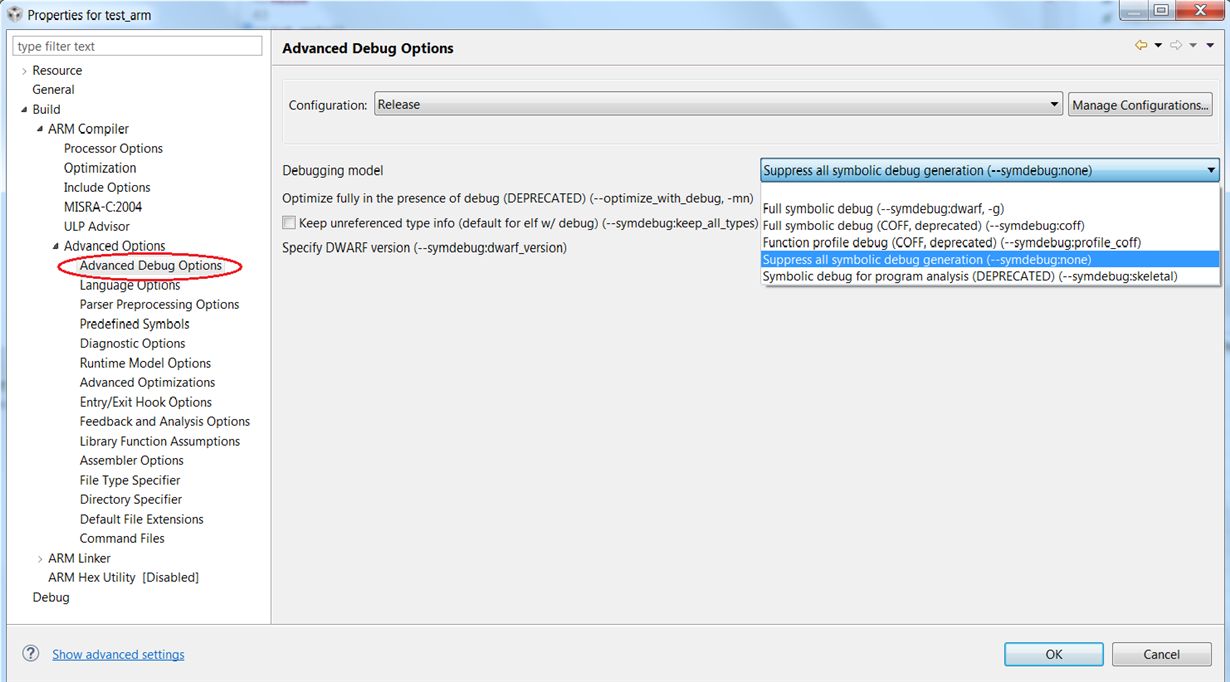
The --opt_level=[0-3] option to the compiler is the easiest way to enable optimizations in TI compilers. While many compilers require the use of an option, such as –g in GCC, to enable debugging, TI compilers generate full debug information by default. For historical reasons, we accept a --symdebug:dwarf option[1] , but it is not required for debug information.
In the following sections, we will examine what effect debug has on optimization, and what effect optimization has on debug when compiling your source programs with Texas Instruments’ compilers.
Effect of debug on optimization
In TI’s compilers, generation of debug information has no effect on compiler optimizations. In other words, the performance and memory footprint of a given application compiled using our tools are not affected by the presence of debug information. For this reason, if you use TI’s Code Composer Studio™ (CCS), you will observe that full symbolic debug information is generated by default for both Debug and Release build configurations.
While debug information has no effect on overall system memory footprint, it does add to the size of an object file. If object file size is a concern, and debugging is not needed, use --symdebug:none to disable generation of debug information.
Effect of optimization on debug
During optimization, the compiler makes transformations to your program to improve its execution time, memory footprint, power consumption, or a combination of these. These transformations significantly change the layout of your code and make it difficult, or impossible, for the debugger to identify the source code that corresponds to a set of instructions.
In general, the higher the level of optimization that is applied, the harder it is to debug the program. This is because higher levels of optimization enable more transformations and apply to broader granularities or scopes of the program. Optimizations at levels 0 and 1 are applied to individual statements or blocks of code within functions, level 2 enables optimizations across blocks of code within a function, level 3 enables optimizations across functions within a file, and level 4 enables optimizations across files. Since transformations that occur at higher levels are usually more widespread, it is harder for the debugger to map the resulting code to the original source program.
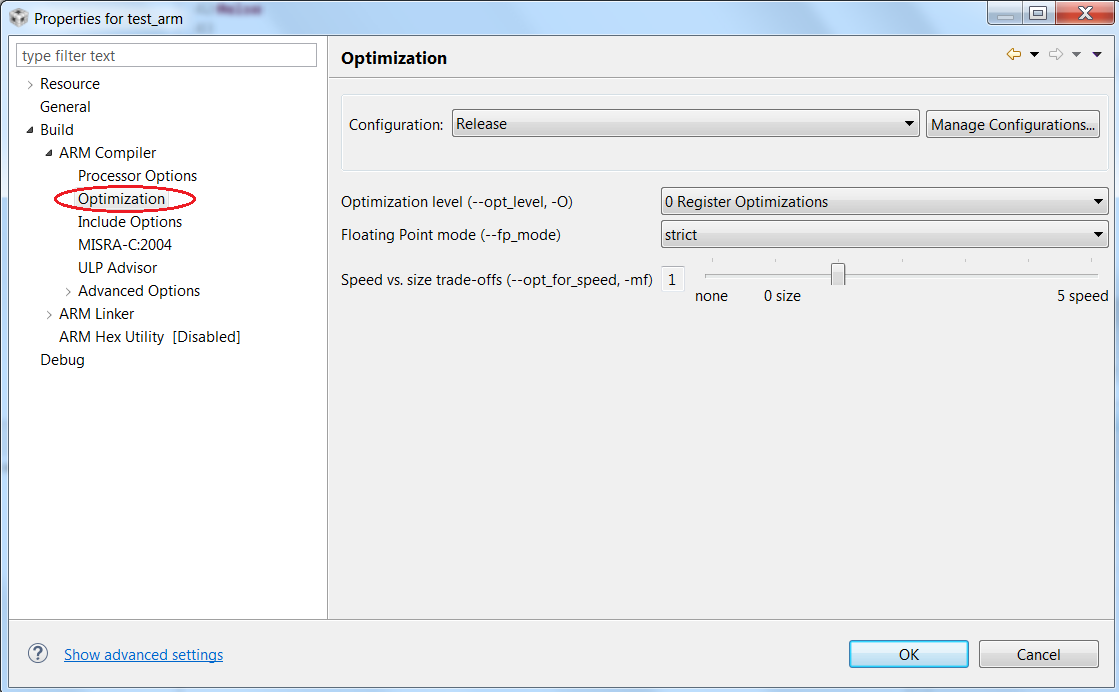
Another compiler option, --opt_for_speed=[0-5], enables optimizations in the context of competing code size and performance tradeoffs. The --opt_for_speed=0 option attempts to improve the code size at a high risk of worsening code performance, while opt_for_speed=5 is geared toward improving the code performance with a high risk of worsening code size. The effects of the use of --opt_for_speed on your debug experience are not as clear as the effects of increasing --opt_level settings, since each --opt_for_speed level enables or disables a complex set of transformations. In most cases, the compiler will perform more aggressive inlining at higher --opt_for_speed levels which might impact debugging.
When optimization limits your ease of debugging, one option is to try lowering the level of optimization to the lowest level of optimization that meets your constraints on code speed, size, and power (see figure above). If the optimization level you need to meet your constraints is still too hard to debug, consider lowering the optimization level for just the one file you need to debug, and not the whole system. By lowering the optimization level for just one file, it is likely you will continue to meet your system constraints, while making it easier to debug that file.
Another option when debugging optimized files is to drop down to assembly language to see what is really going on. The Disassembly view in CCS allows you to step through the actual instructions that are executing. While the assembly language is a lot more verbose and harder to understand, it is an accurate representation of what is executing.
Summary
TI compilers generate full debug information by default. The presence of debug information has no impact on the compiler’s ability to perform optimizations. Our debuggers allow you to debug optimized programs; however, compiler optimizations can affect the ease of debugging. To counteract this, try reducing the optimization level.
For more information about the tradeoffs of debug versus optimization when using our compiler tools, visit this wiki topic. You may also refer to our various compiler manuals to learn more about optimization options and debugging optimized code.
Read more ‘From the Expert’ blogs
- Accessing files and libraries from a linker command file (LCF)
- Executing code from RAM using TI compilers
Footnotes:
[1] Using the --symdebug:dwarf option in TI’s ARM compiler lowers the default optimization level. More specifically, our ARM compiler defaults to --opt_level=3 if no optimization level is specified. If --symdebug:dwarf is used, the default optimization level changes to --opt_level=off (i.e., optimization is disabled). See the compiler manual for your specific compiler for details on interactions between –symdebug:dwarf and default optimization levels.


