This thread has been locked.

If you have a related question, please click the "Ask a related question" button in the top right corner. The newly created question will be automatically linked to this question.

LMP7721:Current noise spectral density

Part Number: LMP7721
Other Parts Discussed in Thread: OPA928

Tool/software:

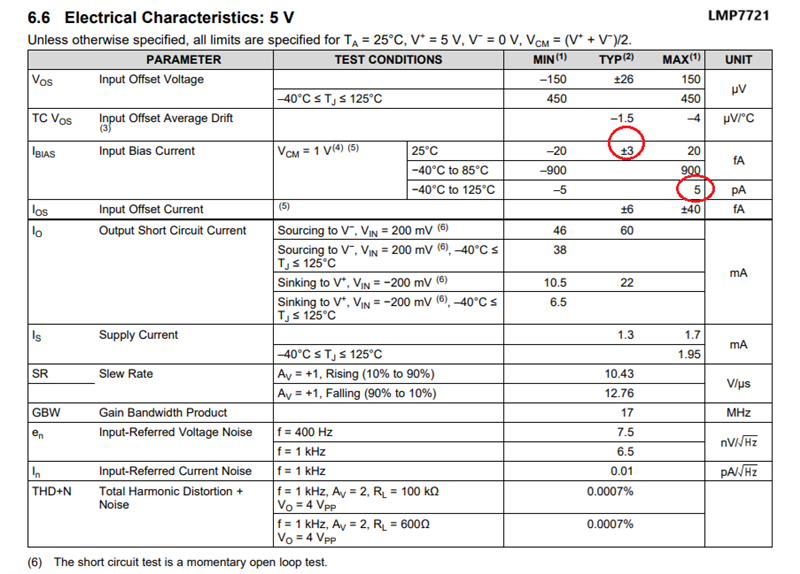
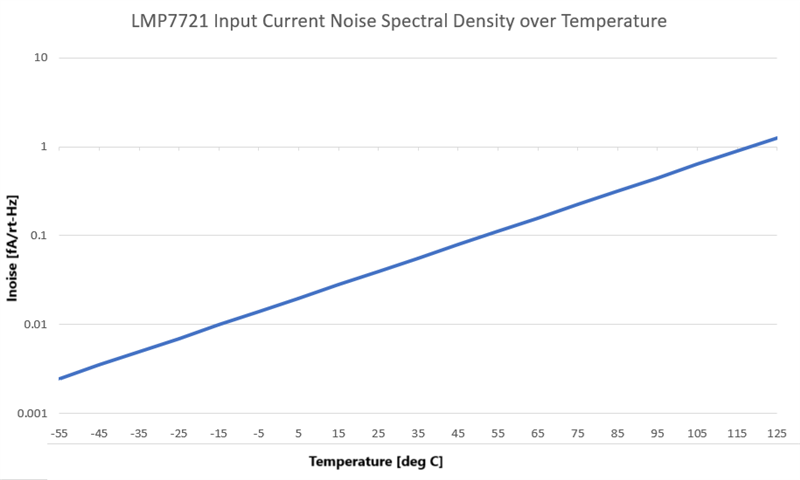
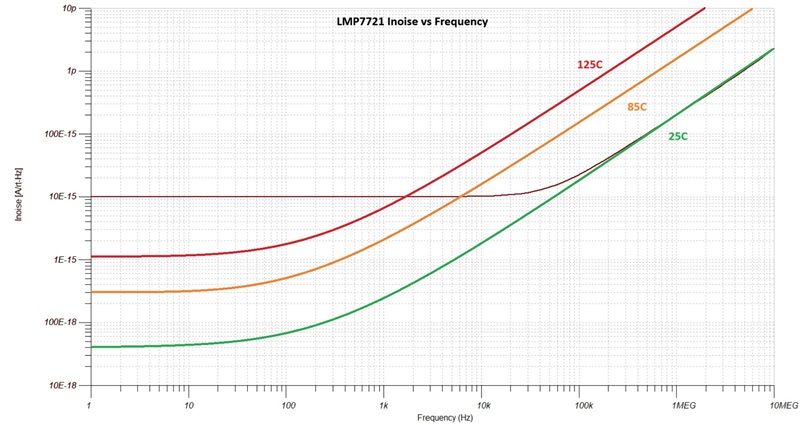
I am considering a TIA circuit. I am not sure whether to use the OPA928 or the LMP7721 op amp. I would like a graph of the current noise spectral density of the LMP7721 for consideration. (Horizontal axis for frequency, vertical axis for current noise spectral density).

  • The low frequency Input Current Noise spectral density is a function of the input bias current:  Inoise = sq-rt(2*q*IB)

    Based on the variation of the LMP7721 IB vs temp (see above), I have calculated the low frequency Inoise vs Temp - see below. 

    Since the IB increases with frequency due to the input capacitance, Inoise will also increase at higher frequency.

  • I would like a graph of A/√Hz and Hz for LMP7721 .

  • The above graph of LMP7721 is in [fA/rt-Hz].  A single graph of Inoise in A/√Hz over frequency and temperature would require creation of a three dimensional figure and unfortunately we do not provide three dimensional graphs. Thus, all I can do here is to graphically interpret for you what can be simulated over frequency at 25C and calculated over temperature - see below.