This thread has been locked.
If you have a related question, please click the "Ask a related question" button in the top right corner. The newly created question will be automatically linked to this question.
Tool/software:
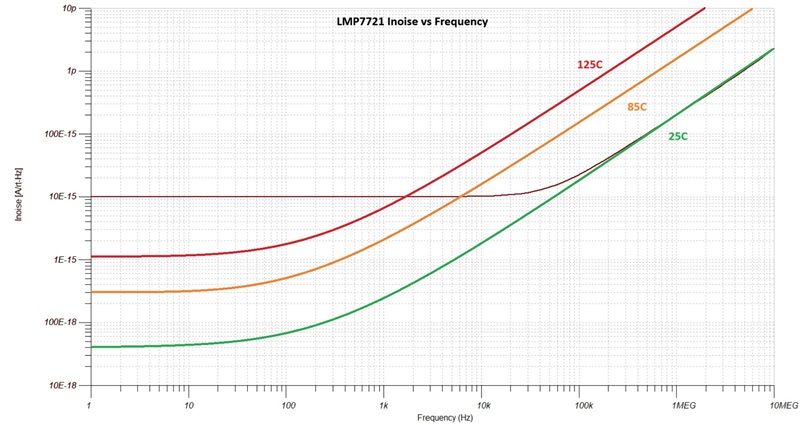
I am considering a TIA circuit. I am not sure whether to use the OPA928 or the LMP7721 op amp. I would like a graph of the current noise spectral density of the LMP7721 for consideration. (Horizontal axis for frequency, vertical axis for current noise spectral density).
The low frequency Input Current Noise spectral density is a function of the input bias current: Inoise = sq-rt(2*q*IB)

Based on the variation of the LMP7721 IB vs temp (see above), I have calculated the low frequency Inoise vs Temp - see below.
Since the IB increases with frequency due to the input capacitance, Inoise will also increase at higher frequency.

The above graph of LMP7721 is in [fA/rt-Hz]. A single graph of Inoise in A/√Hz over frequency and temperature would require creation of a three dimensional figure and unfortunately we do not provide three dimensional graphs. Thus, all I can do here is to graphically interpret for you what can be simulated over frequency at 25C and calculated over temperature - see below.
