


Other Parts Discussed in Thread: OPA2330
Hi team,
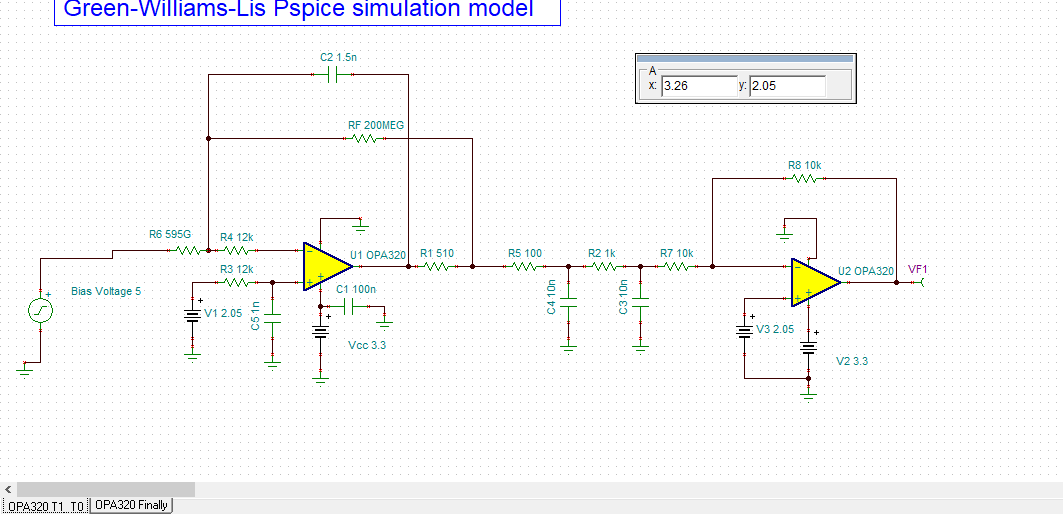
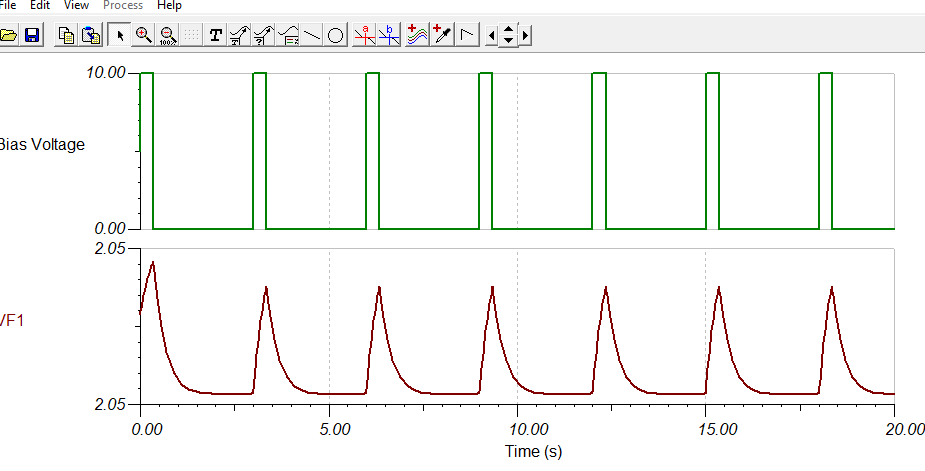
I have designed a OPA2330 circuit in the attach. When I simulate it as below
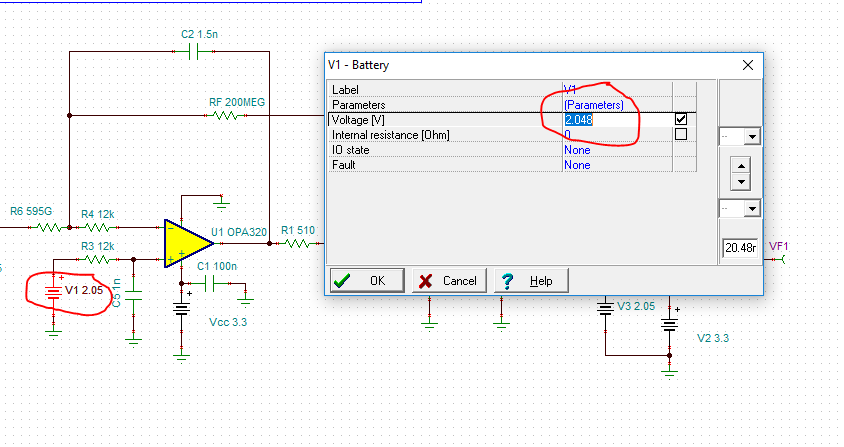
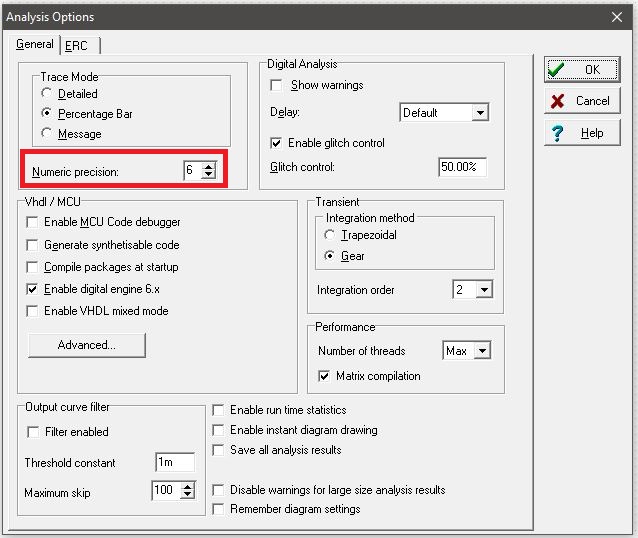
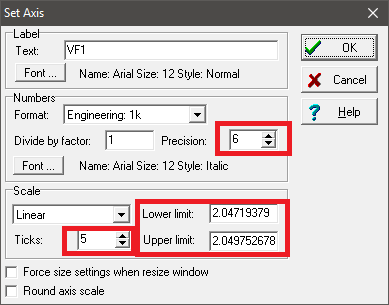
Q1: I set the reference is 2.048V, Why does it display 2.05V? How to change it to display to 2.048V?

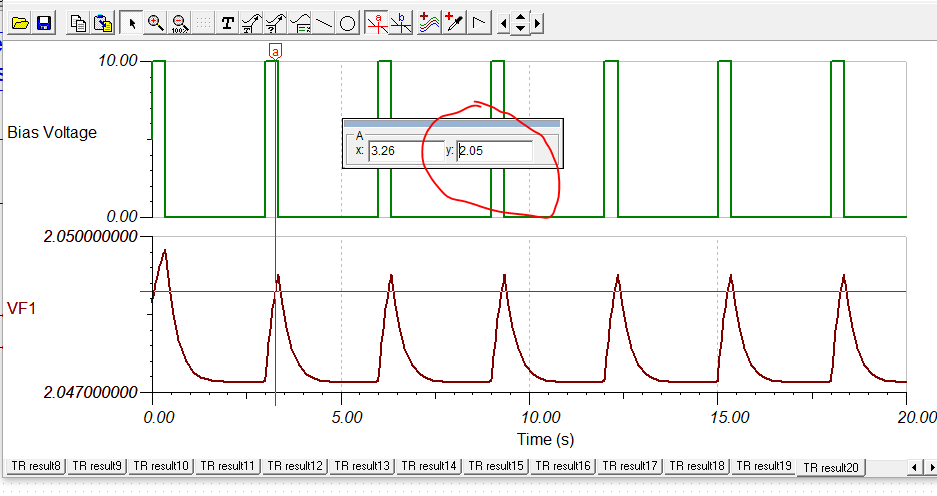

Q2: You may see the waveform. I change the ticks,the Y-axis always display 2.05V. t. Would you help me to change the Y-axis more accurately?

