This thread has been locked.

If you have a related question, please click the "Ask a related question" button in the top right corner. The newly created question will be automatically linked to this question.

LMH6553: LMH6553

Part Number: LMH6553

We are looking to introduce the LMH6553 fully differential amplifier with output limit clamping to our design, but we are having problems understanding the datasheet regarding the noise data.

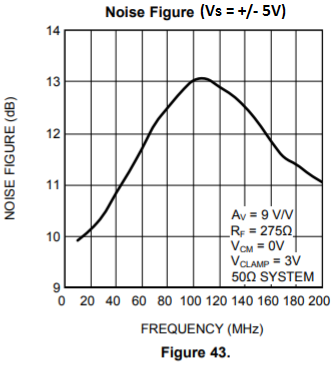
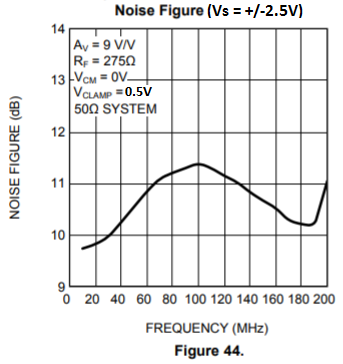
The datasheet shows two graphs, in figures 43 and 44, where the vertical axis is in dB, but it does not state what this is in respect to.

The figures also don’t agree with each other, even though they seem to show exactly the same test conditions.

Please could you clarify data around the noise figures for us?

  • Hi Carlos,

    That is definitely not right, thanks for bringing this to our attention. We are looking into it and will response once we have clarity.
  • Hi Carlos,

    I see this was answered via email so I will repost the answer here for anyone else curious:

    The two graphs in figure 43 and 44 are for the two different supply test conditions with +/-5V (Fig 43) and +/- 2.5V (Fig 44). This information was lost during a datasheet conversion to the new format, and we are working to revise it.

    The vertical axis in the Noise Figure graph is measured with respect to a matched 50-ohm source input, and the calculation for noise figure is below:

    Vout,noise = output referred noise at the amplifier in nV/rtHz

    k = Boltzmann's constant = 1.38E-23 J/'K

    T = absolute temperature in 'K

    Rs = matched source impedance of 50-ohm in this case

    Av = voltage gain in V/V

    Noise figure in dB = 10log10 (NF)