This thread has been locked.

If you have a related question, please click the "Ask a related question" button in the top right corner. The newly created question will be automatically linked to this question.

OPA140: gain vs. frequency simulation does not match data sheet

Genius 12715 points
Part Number: OPA140
Other Parts Discussed in Thread: TINA-TI,

Hello Team,

can you explain why the simulation is not matching the data sheet, please?

What do I need to do to achieve the data sheet frequency response, please?

Thanks and Best Regards,

Hans

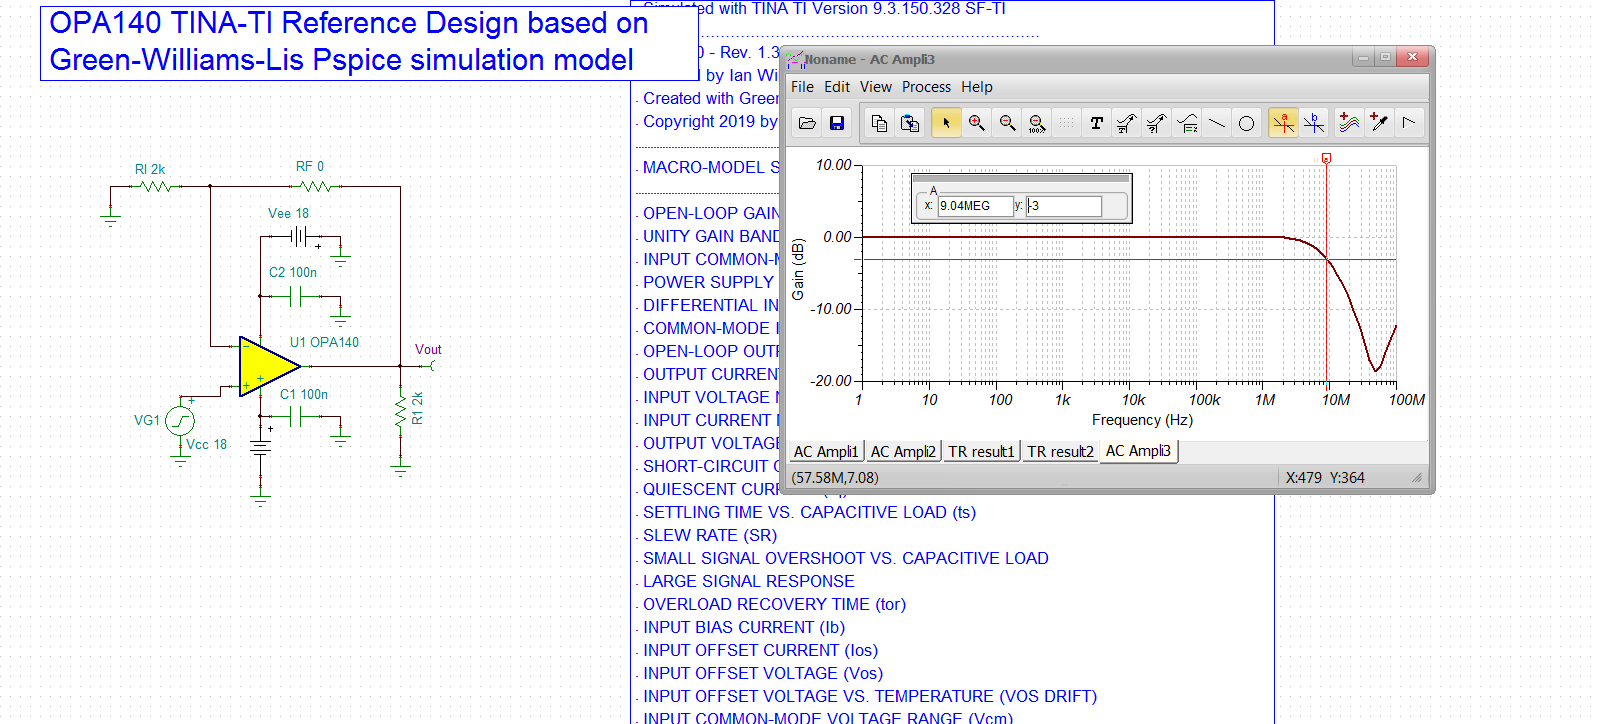
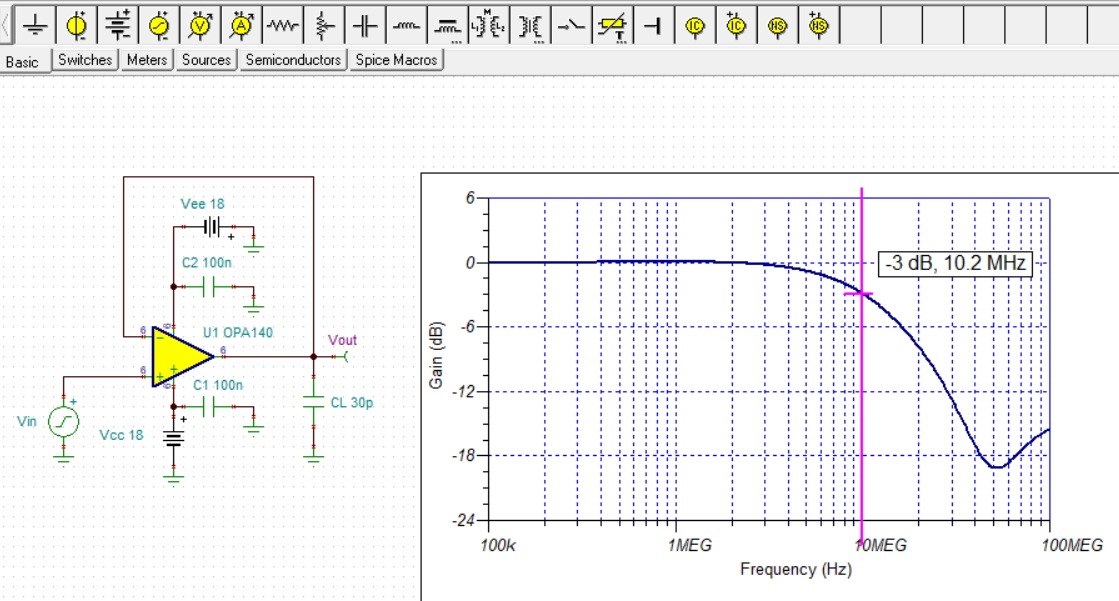
TINA-TI Simulation for a buffer configuration (Gain = +1):
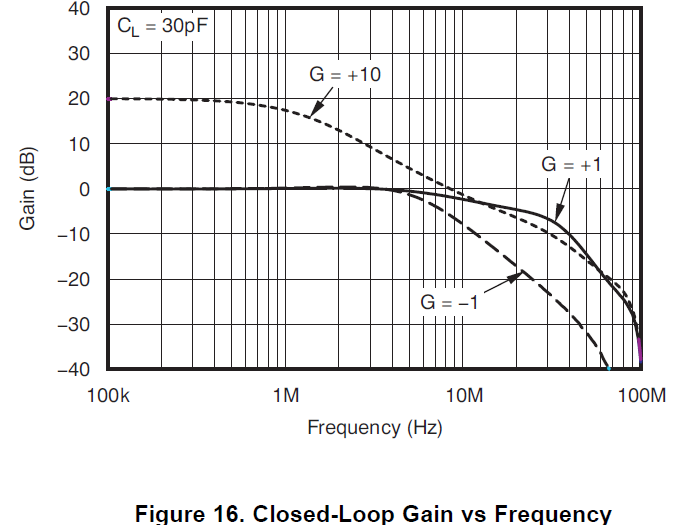
Data sheet page 11:

  • That datasheet plot is indeed hard to explain - those curves were done in 2010 - probably with poor methodology

    There has been a new model update in Jan2019, perhaps more accurate, but even then I can't get over 10Mhz gain of 1 f-3dB. The model updates are not, however, trying to reconcile datasheet disconnects like this one, 

    Here is 2k load which shows up at the top, (9MHz f-3dB?)

    Here is a 30pF (why oh why do these parts specify a cap load - parasitic? or does it have to be added to get this curve? And why would you intentionally do that?). 10MHz F-3dB. I did try to work through some of the BW confusion out there in this article - might not apply in this case, more work would be needed to get resolution 

    https://www.planetanalog.com/why-is-amplifier-gbp-so-confusing-insight-12/

  • Hello Hans,

    There will be differences between what is obtained from a PSpice simulation model and what is measured in the lab. The simulation models are almost always a simplification of the actual device. PSpice has its limits in terms of circuit complexity and size that it can converge upon and provide a meaningful solution. However, despite the limits every effort is made to provide a PSpice model that captures the most critical behaviors. 

    The OPA140 model's closed-loop G = +1 V/V amplitude vs frequency response is correct in the most critical portion of its frequency range. Remember the gain-bandwidth is about 10 to 11 MHz as can be seen in Figure 15 graph, Gain and Phase vs Frequency. When you view Figure 16, the Closed-Loop Gain vs Frequency, the OPA140 in a gain of +1 V/V has a -3 dB bandwidth of about 10 MHz. When I simulate the +1 V/V gain condition -3 dB occurs at just about 10 MHz as seen below.

    I can see from the Figure 15 open-loop gain/phase graph that the phase response isn't ideal indicating that there is some additional pole-zero interaction taking place beyond 1 MHz. That is surely the cause of the second bend downward in the +1 V/V closed response at about 30 MHz, in Fig. 16. But the important point in all of this is this additional pole in Fig 16 and and the bending back of the gain in the simulation response is that they are occurring well above the bandwidth of the OPA140.

    Though it is good you took notice of the deviations in the simulation response, keep in mind that they are occurring at frequencies well above the usable bandwidth of the OPA140. More important is the open-loop gain/phase response in Figure 16, and Figure 18. Open-Loop Output Impedance vs Frequency, both of which are accurately captured in the OPA140 model. They are needed for accurate stability analysis.

     There isn't anything practical you can do to change the closed-loop response you are receiving from the OPA140 model.

    Regards, Thomas

    Precision Amplifiers Applications Engineering

  • And actually, if I look closely at the pds curve, it is about 10MHz F-3dB with that extra zero out around 30Mhz. If you imagine there is an undescribed series output R to a 50ohm termination to provide a sense path to network analyzer, using a typical 0.2pF parasitic C on most R's, the 30Mhz peak would correspond to a series R of 10kohm, not too unreasonable. 

  • Hi Hans,

    We haven't heard from you in a while. We hope the issue was resolved. I am going to close this thread now. If you have any additional comments, please reply to re-open.

    -Tamara