This thread has been locked.

If you have a related question, please click the "Ask a related question" button in the top right corner. The newly created question will be automatically linked to this question.

LME49726: Output characteristics

Part Number: LME49726

Hi team,

My customer has one request and one question. Please support.

Request

Could you provide "output voltage vs output current" graph for both High level and Low level?

Question

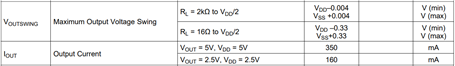
This device should be RRO and the EC table also has such output swing spec. However Figure 24 and 25 Output voltage vs Supply voltage graph have big gap.(The output voltage is 2V when supply voltage is 5.5V)

How do we understand the graph?

Best Regards,

  • Hi Hirai-san,

    Output voltage range is included in the data sheet referred to VDD and VSS (high and low)

    Regarding figure 24 and 25:

    • Output voltage is peak, which means full range is ~0.9*2 = ~1.8V
    • The above consideration is at THD+N = 1%
    • You can also consider figures 2, 4, 6, 8, 10, 12, 14 and 16. These also provide output voltage levels compared to the distortion level. You can notice that top 0.1 level is close to VDD for each plot.

    Best regards,
    -Ivan Salazar
    Applications Engineer

  • Ivan-san,

    Thanks.

    Where is “output voltage vs output current” chart in the datasheet?

    Regards,

  • Hirai-san,

    There is no output voltage vs output current plot,

    I mentioned there is output voltage range referred to power supply (VDD and VSS), and there is also output current spec for a couple voltage levels:

    Best regards,
    -Ivan Salazar
    Applications Engineer