This thread has been locked.

If you have a related question, please click the "Ask a related question" button in the top right corner. The newly created question will be automatically linked to this question.

OPA1642: About the performance of parts

Part Number: OPA1642

Dear Person in Charge,

I'm looking for graphs on the performance of this parts.

List the graphs I'm looking for.

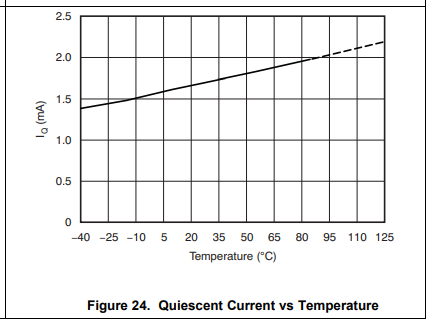
・Relationship graph between power consumption and temperature fluctuation
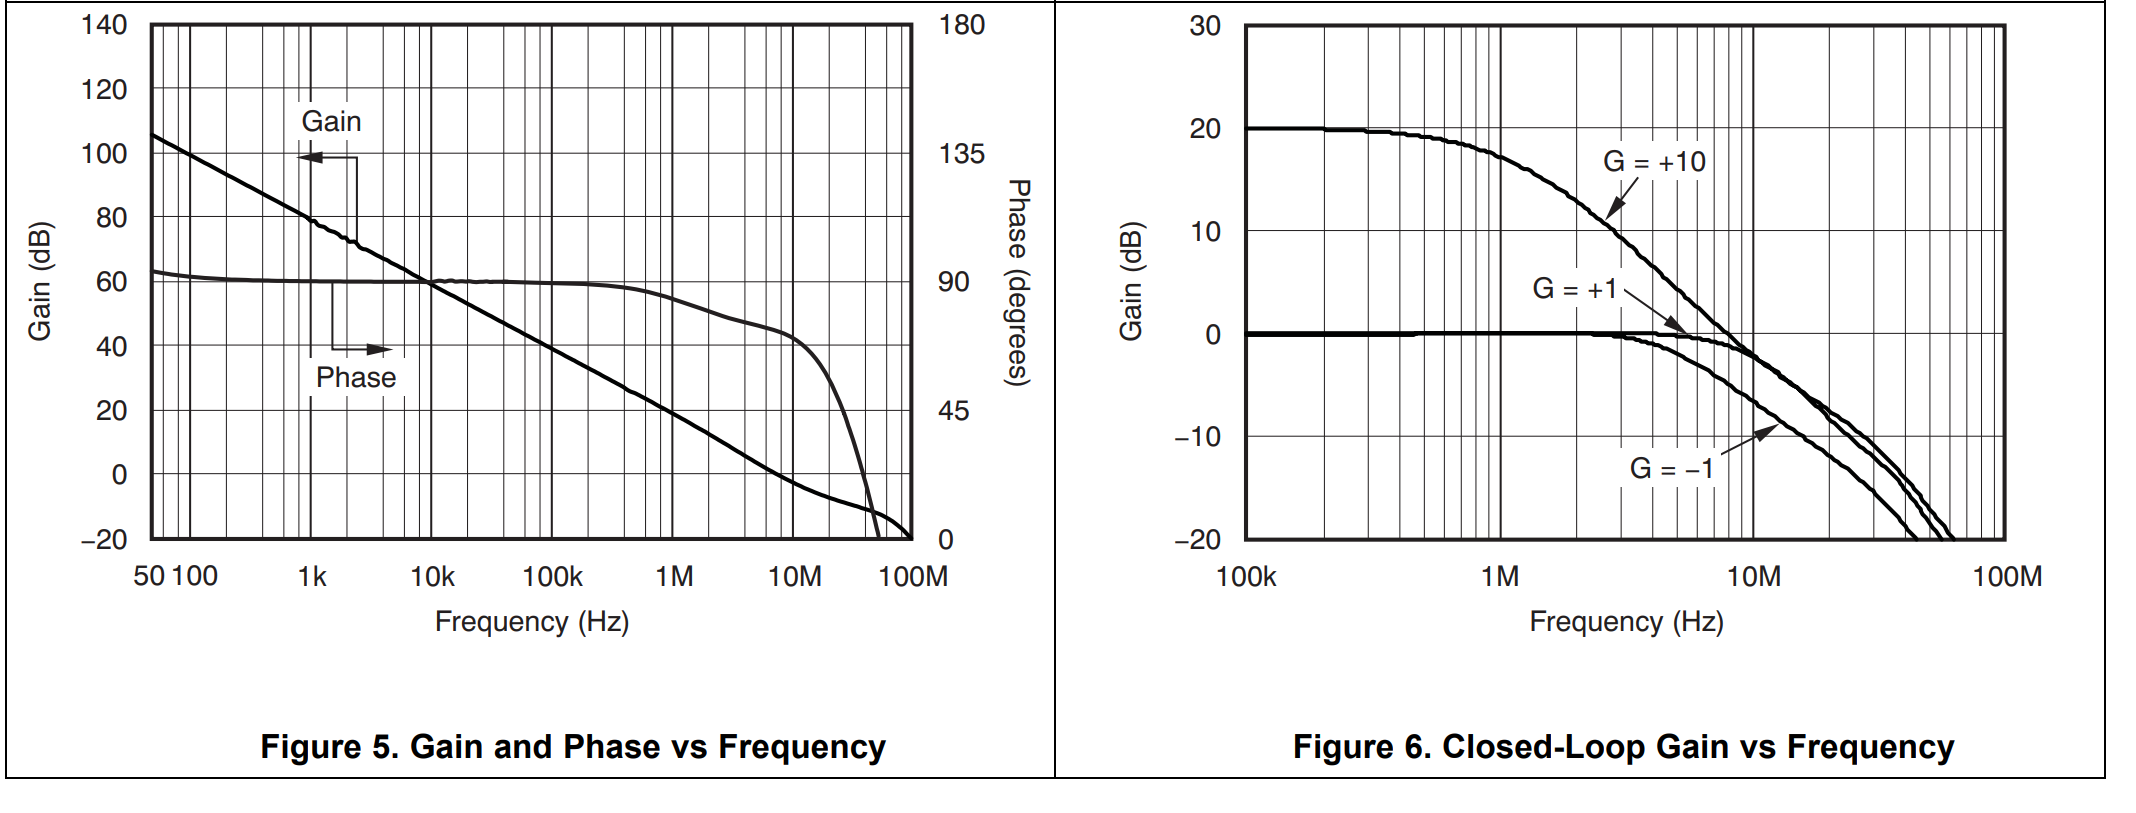
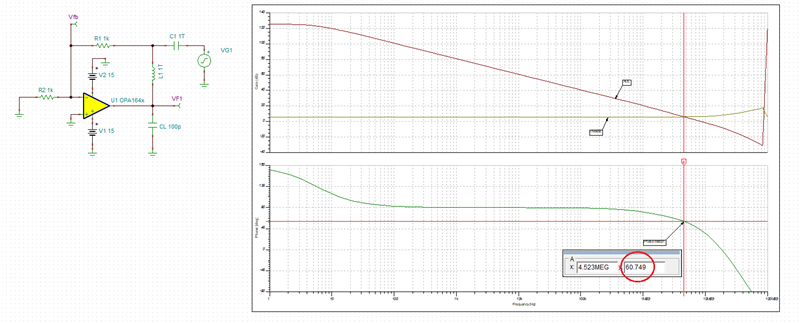
・Graph of relationship between voltage gain, phase and frequency
・Relationship graph of output voltage amplitude and load resistance
・Relationship graph between output voltage and ambient temperature
・Relationship graph between output voltage and power supply voltage
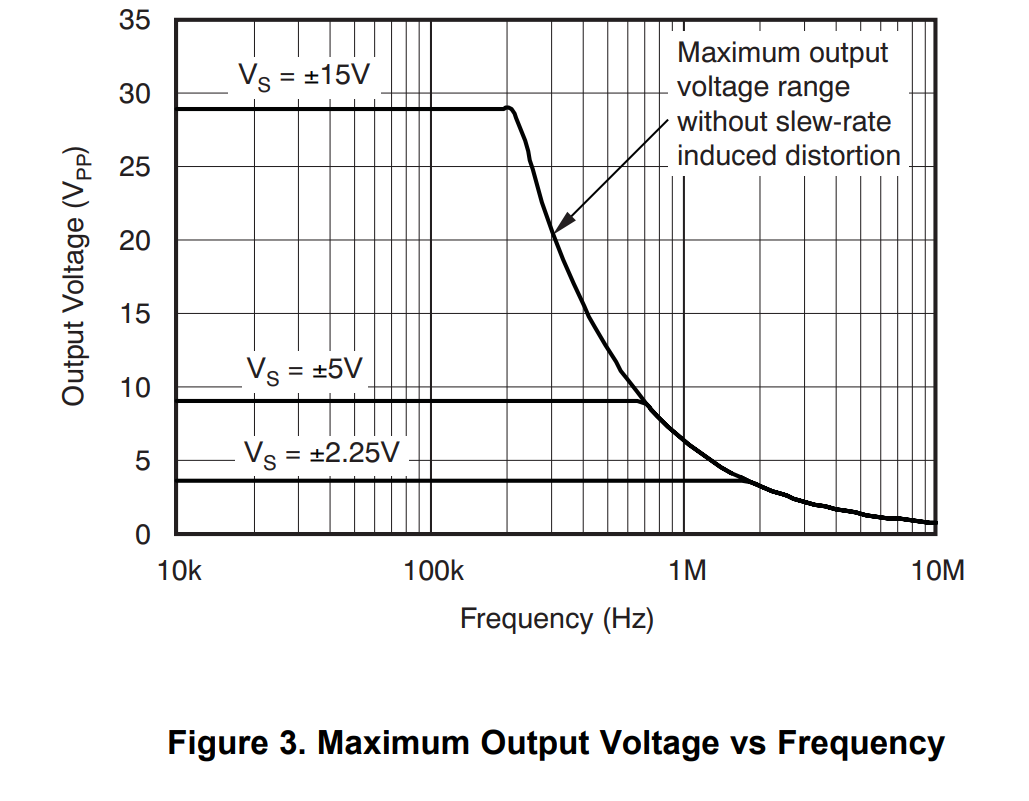
・Relationship graph of output voltage and frequency

that's all, thank you very much.

  • Hello, 

    For detailed power calculations for both AC and DC we have a video module on power that can be found here:

    https://training.ti.com/ti-precision-labs-op-amps-power-and-temperature?context=1139747-1139745-14685-1138799-607342

    We do not have a graph on power consumption and temperature fluctuation, however we do have plots in the product datasheet for Vout vs Iout over temperature. However the video module above will demonstrate how to calculate power for specific conditions. Power has many factors associated so we are unable to provide a plot for this. 

    Graph of relationship between voltage gain, phase and frequency

    Relationship graph of output voltage amplitude and load resistance & Relationship graph between output voltage and ambient temperature

    Relationship graph of output voltage and frequency

    We do not have a plot to provide for power supply and output voltage. PSRR is the closest plot for what you have requested. This plot demonstrates how changes in power supply are rejected by the amplifier. 

    Best Regards, 

    Chris Featherstone

  • Adding to Chris' reply, the power dissipation inside the IC is a function of current and voltage drop within the part, P=I*V.  Thus, for +/-15V supply under quiescent (unloaded) condition, OPA1642 power dissipation is P(@25C) =1.7mA*30V=51mW and P(@125C)=2.2mA*30V=66mW - see IQ vs temperature graph below.  However, under loaded condition you must also include the Iout current in your calculation.

    All graphs must be simulated for the specific conditions, which you do not specify.  For example, for G=-1 driving 100pF, the phase margin is 60 degrees - see below.

    OPA1642 AC Stability.TSC

    All in all, please review TI Precision training material under following link so you know how to set up the simulations for a specific graph you wish to generate: https://training.ti.com/ti-precision-labs-op-amps-introduction?context=1139747-1139745-14685-1138796-14889