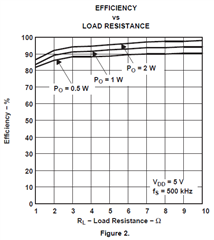
I see this figure in the DRV593 datasheet:

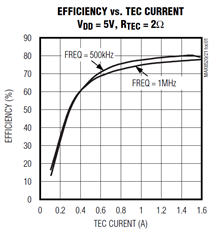
How am I to interpret this diagram? If I have a 2 ohm load at 5V, then that's 12.5W of power. In that case, am I to assume that the PO=0.5 line is implying a very short duty cycle on the PWM to bring that 12.5W number down? And that of course the efficiency is going to be good because most of the duty cycle is off time? This chart seems designed to be obscure. Devices from other manufacturers have clearer efficiency vs drive current charts, like this:

Nearly every other TEC driver on the market has an efficiency curve with a steep dropoff as the drive current decreases like the diagram above. Your chart, on first glance, seems to imply that the the DRV593 is shockingly more efficient, but I'm wondering if you were to show an efficiency vs drive current chart if it would actually have a similar dropoff in efficiency? Can you provide such a chart?

