Hi team,
I downloaded the OPA1622 model on TI's website and used TINA TI to simulate the phase margin at different capacitive loads and found the simulation results to be inconsistent with the datasheet curve.
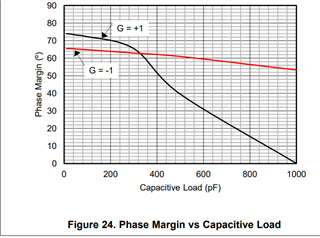
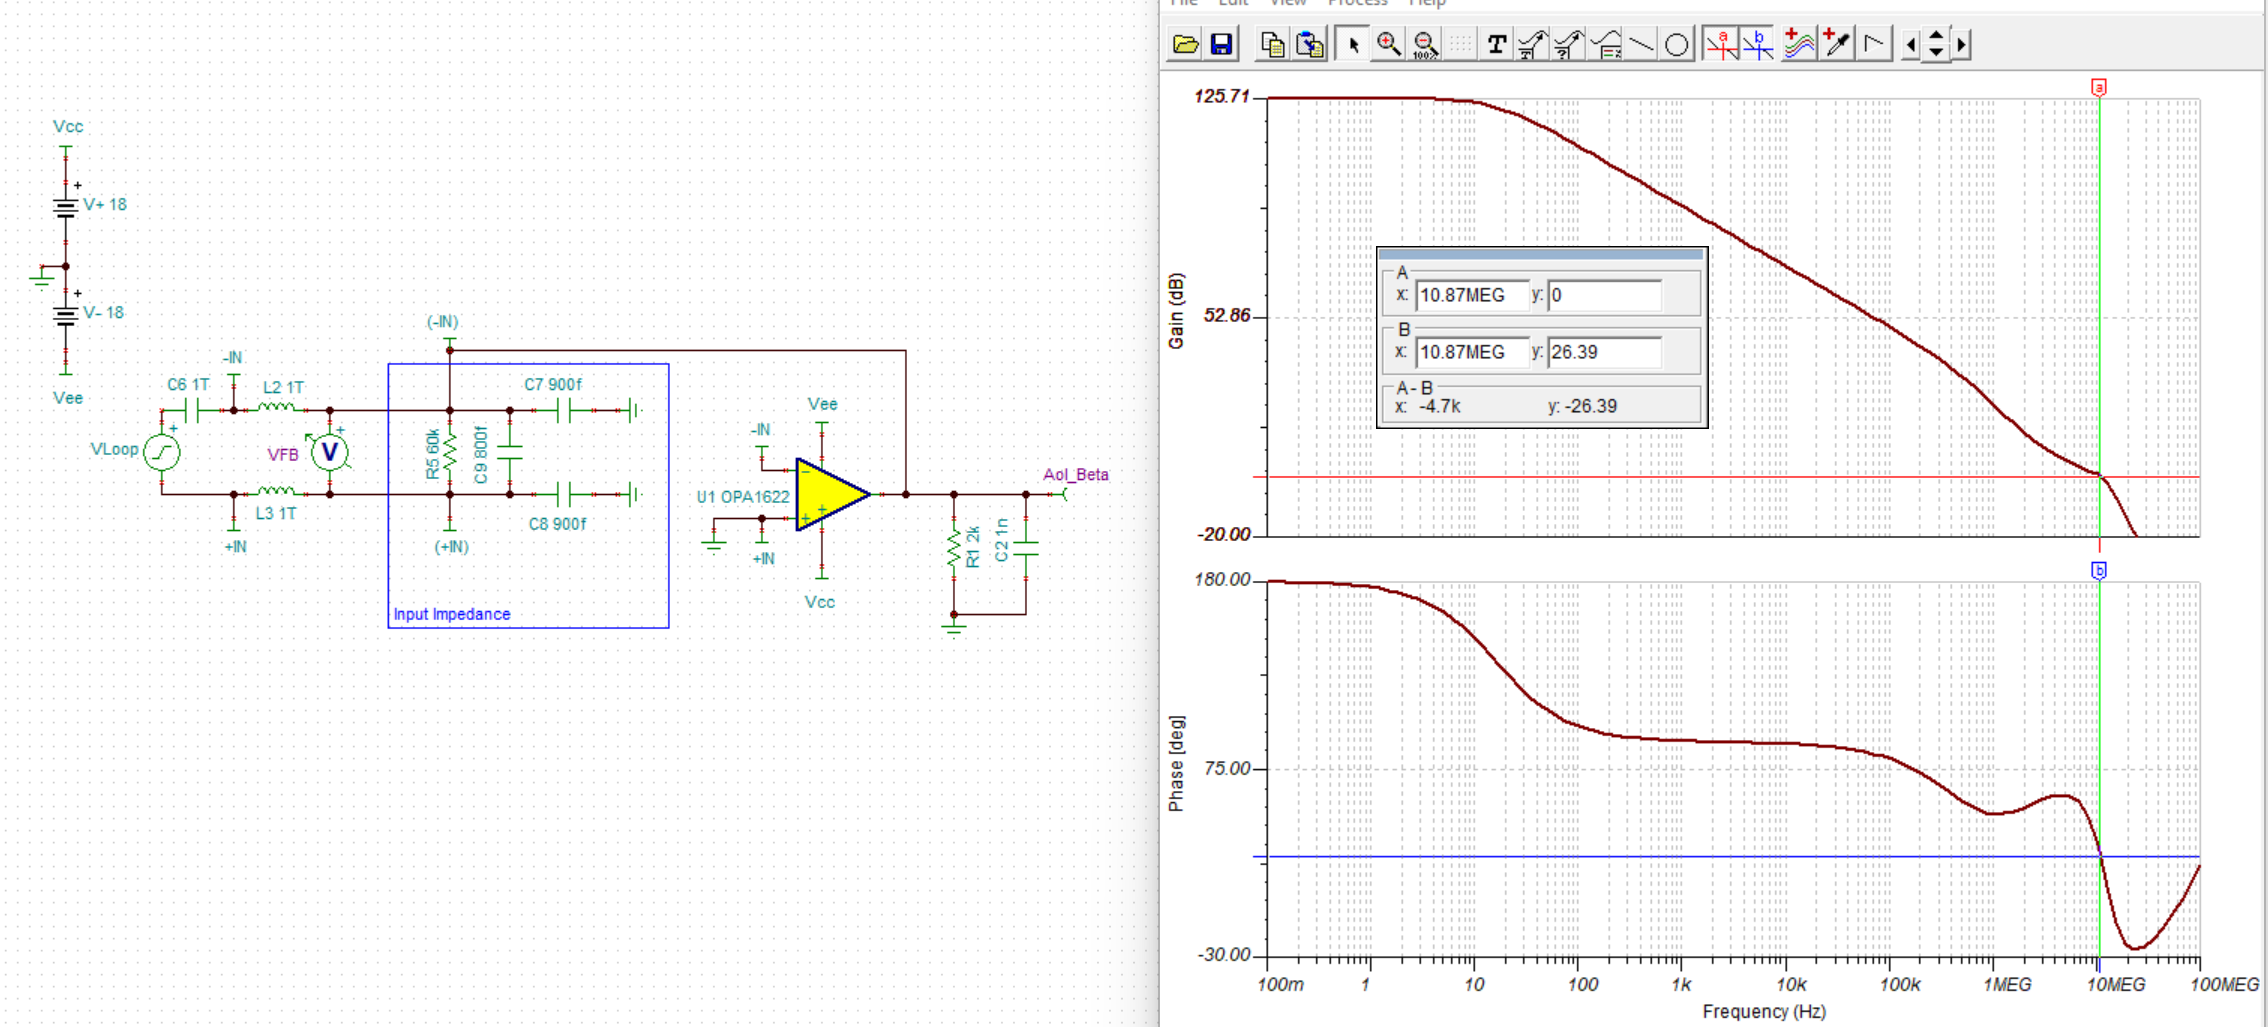
According to the data sheet, the connections are as G=1, 1nf//2K loads, as follows:
Under different capacitive loads, the simulation phase margin is not correct, both are 25° different.
Could you please confirm if the OPA1622 spice model is abnormal or the curve in the datastore is wrong? Thank you.
Best Regards,
Amy