This thread has been locked.

If you have a related question, please click the "Ask a related question" button in the top right corner. The newly created question will be automatically linked to this question.

OPA134: the low pass cutoff frequency of opa134

Part Number: OPA134

Hi TI support team,

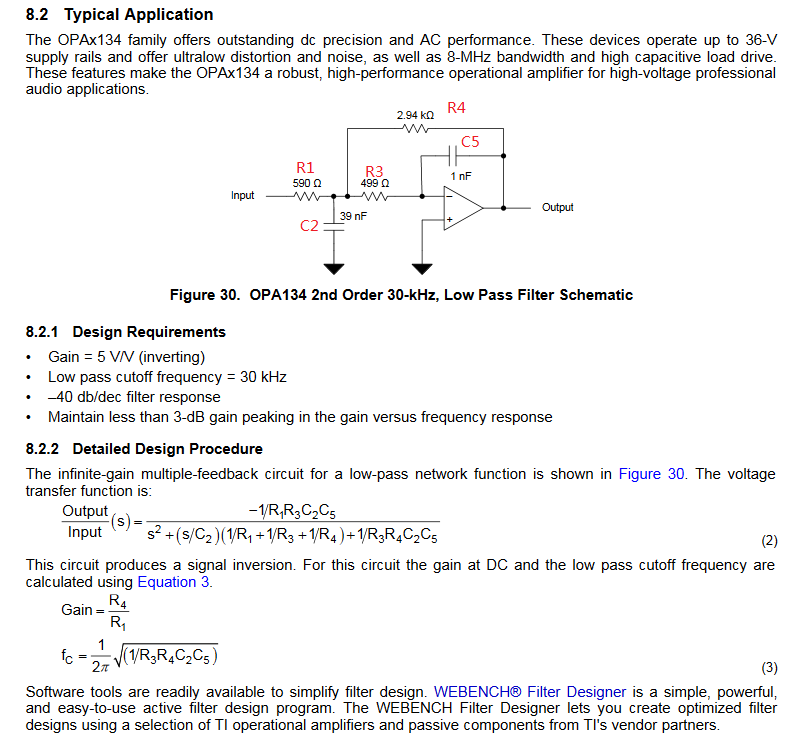
I have a question on page 16 of the OPA134 datasheet. In the typical application, the low pass cutoff frequency is 30 kHz, but my calculation based on Formula (3) is about 21 kHz. I have simulated this circuit on TINA and the filter's - 3dB frequency is about 30kHz. I am confused about these two results.

opa134_filter.TSC

  • Hi Amy,

    the FSF factor seems to be missing in the formula. You should read this appnote:

    sloa049b.pdf

    Kai

  • Hi Amy,

    The fc equation (Eq. 3) that is provided in the OPA134 datasheet is accurate when the 2nd-order active filter section shown has a maximally flat Butterworth response. That filter response is very popular and exhibits a "Q" of 0.71. The filter bandwidth in that particular case is defined by the frequency where the gain is down -3 dB from the flat, passband gain. 

    However, when the circuit shown in Figure 30 is simulated as you did using TINA Spice, there is gain peaking in the frequency response, with the peak occurring at about 17.5 kHz. That peaking indicates that the Q is higher than 0.71, and the -3dB bandwidth not going to be what is obtained using Eq. 3. It does appear that the datasheet information is for a Butterworth example and some clarification would be helpful in distinguishing how the Figure 30 response differs.

    The SLOA049B Application Report that Kai referenced, in Section 7 - Low-Pass Multiple-Feedback (MFB) Architecture, includes the Frequency Scaling Factor (FSF). That factor can be used to account for common filter responses.

    If you need to synthesize a particular active filter, having a certain type of response TI offers some filter tools that makes the job easy. There is the older FilterPro program, and a newer beta version Filter Design Tool. You can find them here:

    https://webench.ti.com/filter-design-tool/design/93

    Here is an example of a 30 kHz, G = 3.53 V/V, Q = 0.71 Butterworth low-pass filter synthesized using FilterPro

    If you apply Eq. 3 from the OPA134 datasheet using the component values shown in the FilterPro schematic, you will find that the Fc works out correctly being equal to 30 kHz.

    Regards, Thomas

    Precision Amplifiers Applications Engineering

  • Hello all,

    The OPA134 data sheet RC in Fig. 30 is aiming at about 3dB peaking - some discussion and an updated set of RC values for a 30kHz Butterworth are in the attached file. The first key thing is what the model is saying for GBP. The freshly updated model is showing a 1pole GBP of 9.7Mhz. Apparently, the PDS is perhaps using the Aol = 0dB for GBP product - that is a common error where the higher Aol pole pulls that crossover back slightly. But, for design purposes we normally really do want that one pole GBP. If you think about it,most of the NG action is happening back at lower frequencies where the Aol set by the single pole model will give you the LG info. you want. The Aol=0dB frequency is interesting for gain of 1 xover, but then the phase margin being <90deg will extend the BW far beyond the GBP model anyway. That data sheet doesn't have any SSBW vs gain curves, but the model shows gain of 1 BW = 13.7Mhz with 1.7dB peaking. That actually matches what the model Aol would predict as shown in the attached.

    Some analysis on the OPA134 MFB filter in PDS section 8.docx

  • Michael,

    That is interesting additional information about the filter. Thank you for contributing to the discussion.

    Regards, Thomas
    Precision Amplifiers Applications Engineering